NDVI and Vegetation Analysis Using Remote Sensing
Table of Contents
- 1. Introduction to Vegetation Analysis and Remote Sensing
- 2. What is NDVI? The Science Behind the Index
- 3. Calculating and Interpreting NDVI Values
- The Mathematical Formula
- Interpreting the Scale (-1 to +1)
- 4. The Remote Sensing Workflow for Vegetation Analysis
- Step 1: Data Acquisition from Satellite Sensors
- Step 2: Image Preprocessing and Atmospheric Correction
- Step 3: Index Calculation and Raster Processing
- Step 4: Classification and Thresholding
- Step 5: Time-Series Analysis and Change Detection
- 5. Key Applications of NDVI Across Industries
- Precision Agriculture and Crop Management
- Forestry and Ecosystem Monitoring
- Climate Change and Environmental Research
- Urban Planning and Green Infrastructure
- 6. Limitations of NDVI and When to Use Alternatives
- The Saturation Problem in High Biomass
- Soil Background Interference
- Alternative Spectral Indices
- 7. Future Trends in Remote Sensing and Vegetation Indices
- 8. Conclusion
- Frequently Asked Questions
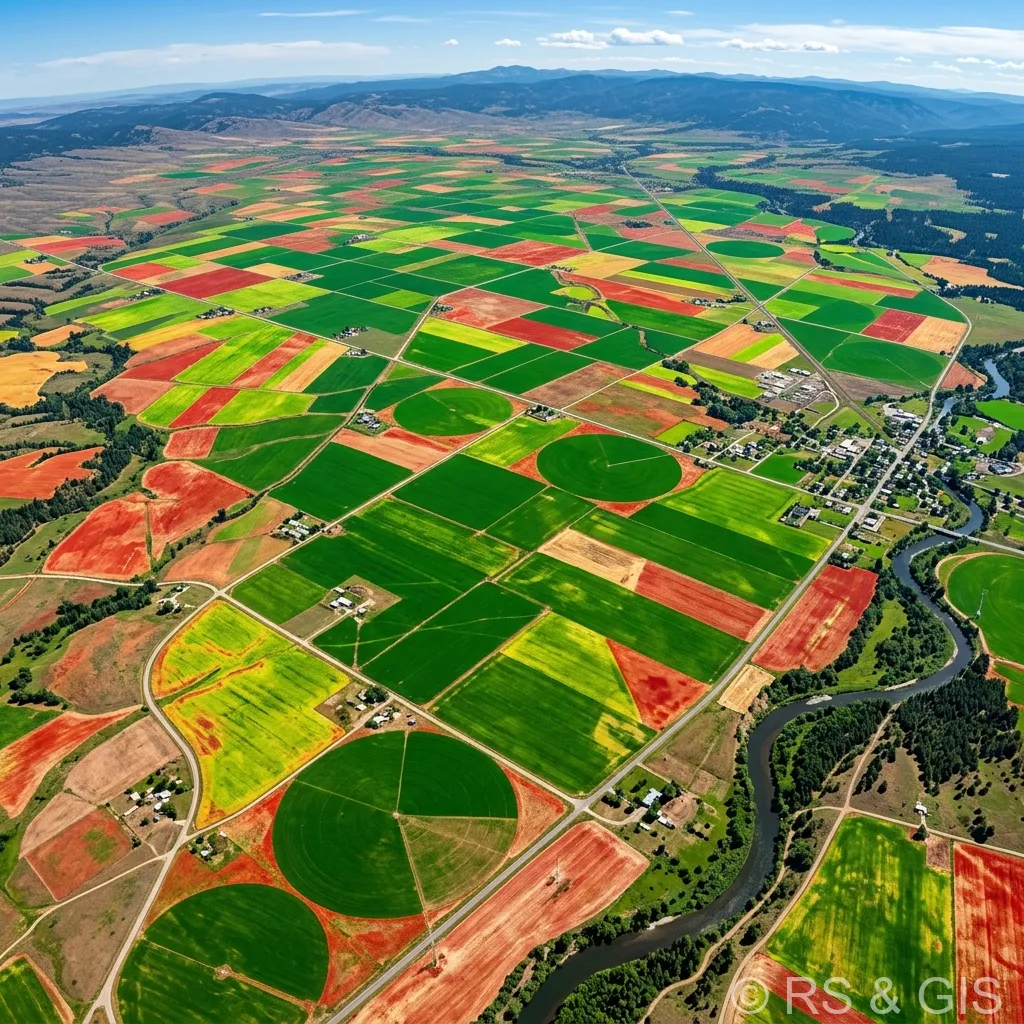
rsandgis.me
1. Introduction to Vegetation Analysis and Remote Sensing
In an era defined by rapid climate change, expanding populations, and the urgent need for sustainable resource management, monitoring the Earth's vegetation has never been more critical. Traditional methods of terrestrial surveying and manual crop inspection are highly localized, time-consuming, and cost-prohibitive on a large scale. Enter remote sensing, the science of obtaining information about objects or areas from a distance, typically from aircraft or satellites. Remote sensing has revolutionized our ability to observe the planet, providing a macro-level perspective backed by micro-level data.
At the heart of remote sensing for ecological and agricultural monitoring is vegetation analysis. By analyzing the way plant life interacts with the electromagnetic spectrum, scientists can determine not only where vegetation exists but also assess its health, density, and growth stages. The cornerstone of this analytical capability is a simple yet profoundly impactful metric: the Normalized Difference Vegetation Index (NDVI).
This guide explore the mechanics of NDVI, the underlying physics of remote sensing, the mathematical formulations that make it work, its vast array of industrial applications, and the modern alternatives designed to overcome its inherent limitations. Whether you are an agronomist seeking to optimize crop yields, a data scientist processing satellite imagery, or an environmentalist tracking deforestation, mastering NDVI is an indispensable skill in the modern geospatial toolkit.
2. What is NDVI? The Science Behind the Index
The Normalized Difference Vegetation Index (NDVI) is a standardized way to measure healthy vegetation. To understand how NDVI functions, one must first understand the biological processes of plants and how they interact with sunlight.
When sunlight strikes a plant, the leaves either absorb, transmit, or reflect different wavelengths of light. The two most critical regions of the electromagnetic spectrum for vegetation analysis are the Visible Red band and the Near-Infrared (NIR) band.
- Visible Red Light (approx. 600-700 nm): Healthy plants contain an abundance of chlorophyll, the green pigment responsible for photosynthesis. Chlorophyll strongly absorbs visible light, particularly in the blue and red wavelengths, using this energy to convert carbon dioxide and water into glucose. Therefore, healthy vegetation reflects very little red light.
- Near-Infrared Light (approx. 700-1100 nm): Unlike visible light, near-infrared light is not used for photosynthesis. In fact, absorbing too much NIR energy could overheat the plant and damage its cellular structure. As a result, the spongy mesophyll cells within the internal structure of healthy leaves act as highly efficient reflectors of NIR light.
The contrast between these two bands forms the fundamental basis of NDVI. A healthy, dense canopy will absorb most of the red light hitting it while reflecting a massive amount of near-infrared light. Conversely, stressed, diseased, or dead vegetation, as well as non-vegetated surfaces like soil, water, and concrete, will show a significantly different reflectance signature, usually reflecting more red light and less NIR light.
3. Calculating and Interpreting NDVI Values
The Mathematical Formula
NDVI mathematically quantifies the contrast between the near-infrared and red bands. It is calculated as a ratio using the following standardized formula:
NDVI = (NIR - Red) / (NIR + Red)
By normalizing the difference between these two bands (dividing the difference by the sum), the index mitigates the effects of variations in illumination, such as shadows caused by topography or changes in the sun's angle. This normalization ensures that NDVI values remain comparable across different seasons, locations, and satellite sensors.
Interpreting the Scale (-1 to +1)
The result of the NDVI calculation always yields a value between -1.0 and +1.0. Understanding how to interpret these values is crucial for accurate vegetation classification and health assessment.
| NDVI Value Range | Typical Land Cover Interpretation | Biological Meaning |
|---|---|---|
| -1.0 to 0.0 | Water bodies, snow, ice, clouds | No vegetation present. These surfaces reflect visible light more strongly than NIR. |
| 0.0 to 0.1 | Bare soil, rocks, sand, urban infrastructure, concrete | Non-vegetated terrestrial surfaces. Reflectance in both bands is relatively similar. |
| 0.1 to 0.3 | Sparse vegetation, shrubs, stressed crops, senescing leaves | Low biomass, early stages of growth, or severe plant stress due to drought/disease. |
| 0.3 to 0.6 | Moderate vegetation, grasslands, healthy crops in mid-season | Healthy, actively growing plants with moderate canopy cover and chlorophyll content. |
| 0.6 to 1.0 | Dense vegetation, temperate and tropical forests, crops at peak growth | High biomass, dense canopy, maximum chlorophyll activity and optimal plant health. |
4. The Remote Sensing Workflow for Vegetation Analysis
Conducting a robust vegetation analysis using NDVI involves a structured workflow that transforms raw satellite data into actionable ecological insights. This process generally involves five crucial stages:
Step 1: Data Acquisition from Satellite Sensors
The first step requires obtaining multispectral imagery that captures both red and NIR bands. Several prominent satellite missions provide this data, catering to different spatial and temporal resolution needs:
- Landsat Series (USGS/NASA): Landsat 8 and 9 provide a spatial resolution of 30 meters and a revisit time of 8-16 days. They are the gold standard for long-term ecological monitoring due to a continuous historical archive dating back to the 1970s.
- Sentinel-2 (European Space Agency - Copernicus): Offering a higher spatial resolution of 10 meters for its visible and NIR bands, Sentinel-2 boasts a rapid revisit time of just 5 days, making it ideal for precision agriculture.
- MODIS (NASA): Though its spatial resolution is coarse (250m to 1km), MODIS captures daily imagery, making it exceptional for tracking rapid, large-scale phenological changes globally.
- Commercial Constellations (Planet, Maxar): For ultra-high precision, commercial satellites provide sub-meter resolution and daily revisits, which are invaluable for commercial agribusiness and hyper-local monitoring.
Step 2: Image Preprocessing and Atmospheric Correction
Before calculating NDVI, raw satellite images (Top of Atmosphere or TOA reflectance) must be preprocessed. The Earth's atmosphere is filled with gases, water vapor, and aerosols that scatter and absorb sunlight, distorting the true reflectance of the Earth's surface. Atmospheric correction converts TOA reflectance to Surface Reflectance (SR), isolating the true spectral signature of the vegetation. Advanced algorithms, such as DOS (Dark Object Subtraction) or FLAASH, are commonly deployed in GIS environments to perform this correction.
Step 3: Index Calculation and Raster Processing
Using Geographic Information Systems (GIS) software like QGIS, ArcGIS, or programming libraries in Python (e.g., Rasterio, GDAL) and R, the NDVI formula is applied pixel by pixel across the entire satellite image. This operation generates a new single-band raster file where each pixel contains the calculated NDVI value, producing a continuous gradient map of vegetation density.
Step 4: Classification and Thresholding
The continuous NDVI raster is often visualized using a color ramp (symbology), typically ranging from brown (low NDVI) to dark green (high NDVI). Analysts can establish thresholds to classify the image into discrete land-cover categories.
For instance, setting a threshold where all pixels > 0.4 are classified as "Forest" and pixels < 0.1 are "Bare Earth."
Step 5: Time-Series Analysis and Change Detection
A single NDVI image provides a snapshot, but true analytical power emerges from time-series analysis. By calculating NDVI over the same geographic area across weeks, months, or years, analysts can track the phenological lifecycle of crops, monitor the progression of droughts, or quantify deforestation. Change detection algorithms subtract historical NDVI maps from current ones to highlight areas of significant vegetation loss or gain.
5. Key Applications of NDVI Across Industries
The versatility of NDVI has cemented its status as a critical metric across multiple scientific and commercial disciplines.
Precision Agriculture and Crop Management
In precision agriculture, NDVI is the ultimate tool for maximizing yield and minimizing waste. By regularly monitoring fields with drones or Sentinel-2 imagery, farmers can identify zones of crop stress long before they become visible to the naked eye. Key use cases include:
- Variable Rate Application (VRA): Farmers use NDVI maps to precisely apply nitrogen fertilizers only where crops show nutrient deficiency, reducing chemical runoff and lowering operational costs.
- Irrigation Management: NDVI anomalies can highlight uneven water distribution, allowing growers to optimize irrigation pivots and address drought stress proactively.
- Yield Forecasting: By correlating peak-season NDVI values with historical harvest data, agribusinesses can build predictive models to estimate final crop yields, informing supply chain and commodities trading.
Forestry and Ecosystem Monitoring
For forestry commissions and conservationists, NDVI facilitates the management of massive, remote tracts of land. It is used to monitor deforestation in the Amazon basin, track the devastating impacts of wildfires, and assess the success of post-fire reforestation efforts. Also, NDVI time-series are instrumental in identifying pest infestations, such as the spread of the mountain pine beetle, by detecting the subtle decline in canopy health before widespread die-offs occur.
Climate Change and Environmental Research
Climatologists rely heavily on NDVI data, particularly from sensors like MODIS and AVHRR, to track the Earth's shifting biomes. Global NDVI datasets have revealed a phenomenon known as "Global Greening", an overall increase in leaf area primarily driven by carbon dioxide fertilization. Conversely, NDVI also maps expanding desertification in regions like the Sahel, providing critical data for international climate policy and mitigation strategies.
Urban Planning and Green Infrastructure
Urban planners use NDVI to map the distribution of green spaces within cities, aiding in the development of sustainable infrastructure. Correlating NDVI with thermal infrared satellite data helps municipalities identify and combat the Urban Heat Island (UHI) effect. By pinpointing concrete-heavy areas with low NDVI, planners can strategically plant trees and install green roofs to lower urban temperatures and improve public health.
6. Limitations of NDVI and When to Use Alternatives
While NDVI is ubiquitous, it is not without its flaws. Understanding its limitations is essential for rigorous scientific analysis.
The Saturation Problem in High Biomass
The most significant limitation of NDVI is saturation. In environments with incredibly dense canopies, such as tropical rainforests or crops at peak maturity (like tall corn), the red light absorption maxes out. Even if the biomass continues to increase, the NDVI value plateaus (usually around 0.8 or 0.9). This makes it nearly impossible to distinguish between a dense canopy and a very dense canopy.
Soil Background Interference
In early crop growth stages or arid environments where vegetation is sparse, the underlying soil heavily influences the spectral reflectance. Dark, wet soils reflect differently than bright, dry soils, which can artificially skew the NDVI calculation, making sparse vegetation appear either healthier or weaker than it truly is.
Alternative Spectral Indices
To overcome these challenges, the remote sensing community has developed specialized alternative indices:
- EVI (Enhanced Vegetation Index): EVI integrates the blue band to correct for atmospheric scattering and adjusts for soil background noise. Crucially, EVI does not saturate as quickly in high-biomass regions, making it superior for mapping dense forests.
- SAVI (Soil Adjusted Vegetation Index): SAVI introduces a soil brightness correction factor (L) into the NDVI equation. It is the preferred index for arid regions and early-stage agricultural monitoring where the canopy has not yet closed.
- NDRE (Normalized Difference Red Edge): Instead of the standard visible red band, NDRE uses the "Red Edge" band (the transition zone between red and NIR). NDRE penetrates deeper into the plant canopy and is highly sensitive to chlorophyll content, making it excellent for detecting stress in late-stage, dense crops where NDVI has saturated.
- VCI (Vegetation Condition Index): VCI compares the current NDVI to the historical minimum and maximum NDVI values for that exact pixel. It is widely used by meteorological organizations for mapping drought severity.
7. Future Trends in Remote Sensing and Vegetation Indices
The future of vegetation analysis is rapidly evolving, driven by the convergence of cloud computing, artificial intelligence, and advanced sensor technology. The integration of Machine Learning (ML) and Deep Learning architectures (like Convolutional Neural Networks) with massive NDVI datasets is enabling highly automated, pixel-perfect land-cover classification and real-time anomaly detection.
Also, the rise of Hyperspectral Remote Sensing, which captures hundreds of narrow spectral bands instead of just a few broad ones, allows for the creation of hyper-specific vegetation indices. Soon, analysts will not only calculate general plant health but will remotely identify specific plant species, detect precise chemical deficiencies (e.g., distinguishing between nitrogen and potassium lack), and measure plant water content directly.
Coupled with the democratization of data through cloud platforms like Google Earth Engine and Microsoft Planetary Computer, processing global-scale NDVI time-series that once took supercomputers months can now be executed in seconds. This accessibility ensures that vegetation indices will remain at the forefront of tackling the world's most pressing agricultural and environmental challenges.
8. Conclusion
The Normalized Difference Vegetation Index (NDVI) is far more than a simple mathematical ratio; it is a vital diagnostic tool for the Earth's biosphere. By exploiting the evolutionary biology of plants and their interaction with the electromagnetic spectrum, NDVI translates invisible spectral signatures into clear, actionable data. From a farmer tuning a variable-rate fertilizer spreader in the American Midwest to a climate scientist modeling the carbon sink of the Amazon rainforest, NDVI provides the empirical foundation necessary for informed decision-making.
While newer indices like EVI and NDRE offer specialized advantages in certain contexts, NDVI remains the bedrock of remote sensing vegetation analysis due to its simplicity, historical continuity, and universal applicability. As satellite constellations multiply and spatial resolutions sharpen, the power of NDVI to monitor, protect, and optimize our natural world will only continue to grow.
Frequently Asked Questions
What is NDVI?
The Normalized Difference Vegetation Index (NDVI) is a widely used remote sensing metric that quantifies the health and density of vegetation. It is calculated from satellite imagery by comparing the reflection of near-infrared light (which healthy leaves reflect) to visible red light (which leaves absorb).
How do you calculate NDVI?
The formula for NDVI is (NIR - Red) / (NIR + Red). The result is always a number between -1 and +1. Values closer to +1 indicate dense, healthy green vegetation, while values near 0 or negative indicate bare soil, rock, urban areas, or water.
Why is near-infrared (NIR) light used for vegetation analysis?
Healthy plant chlorophyll strongly absorbs visible red light for photosynthesis, while the cellular structure of leaves strongly reflects near-infrared (NIR) light to prevent overheating. Measuring this sharp contrast provides a very reliable indicator of plant health.
