Monitoring Agricultural Drought Using Landsat TIRS
Table of Contents
- The Physiological Basis of Crop Water Stress
- The Evolution of Landsat Thermal Infrared Sensors (TIRS)
- Understanding the Crop Water Stress Index (CWSI)
- Empirical vs. Analytical Approaches to CWSI
- The Empirical Approach
- The Analytical Approach
- Step-by-Step: Calculating CWSI using Landsat TIRS Data
- Step 1: Data Acquisition and Preprocessing
- Step 2: Deriving Land Surface Temperature (LST)
- Step 3: Estimating Canopy Temperature
- Step 4: Integrating Meteorological Data
- Step 5: Final CWSI Computation
- Scaling Up: Monitoring Agricultural Drought at Scale
- The Role of CWSI in Precision Agriculture
- Challenges and Limitations in Thermal Remote Sensing
- Cloud Cover and Temporal Resolution
- Spatial Resolution vs. Field Size
- Complexities of the Soil Background
- Case Studies and Real-World Applications
- California's Central Valley
- The Murray-Darling Basin, Australia
- Future Outlook: The Road to Landsat Next
- Integrating Artificial Intelligence and Machine Learning
- Policy Implications and Water Governance
- Conclusion
- Frequently Asked Questions
rsandgis.me
The increasing frequency and severity of droughts worldwide pose a significant threat to global food security, economic stability, and environmental sustainability. As climate change continues to alter precipitation patterns and increase evaporation rates across different climatic zones, the need for effective, scalable, and highly accurate methods for tracking crop health and water availability has never been more urgent. One of the most powerful tools currently available to researchers, agronomists, and policymakers is the application of satellite remote sensing. Specifically, monitoring agricultural drought using landsat thermal infrared sensor technologies has revolutionized our ability to detect early signs of water stress in crops long before they become visible to the naked eye. This guide will explore the theoretical and practical applications of using the Thermal Infrared Sensor (TIRS) on Landsat 8 and 9 to calculate the Crop Water Stress Index (CWSI), ultimately enabling the monitoring of agricultural drought at an unparalleled spatial and temporal scale.
The Physiological Basis of Crop Water Stress
Water stress is a primary limiting factor in agricultural production and yield potential. When crops do not receive adequate water to meet their transpirational demands, they undergo a series of physiological and biochemical changes designed to survive the deficit. One of the very first responses is the closure of stomata, tiny pores located primarily on the underside of the leaves. Stomatal closure helps the plant conserve its internal moisture by drastically reducing the rate of transpiration, which is the process by which water vapor is released from the plant into the atmosphere.
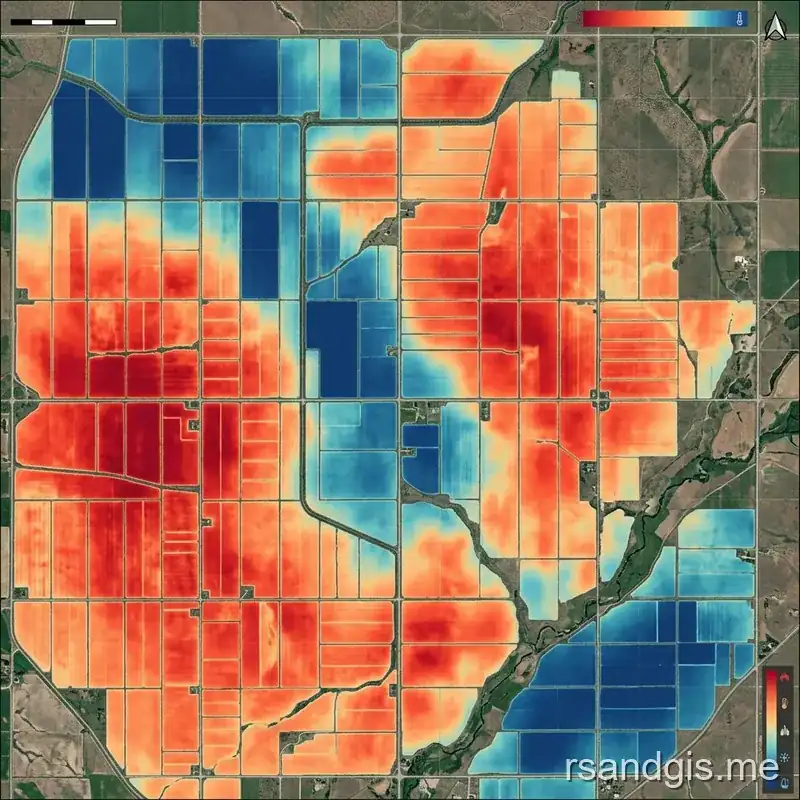
Under normal, well-watered conditions, transpiration acts much like sweating in humans; it provides a cooling effect that maintains the plant canopy at an optimal temperature, often lower than the surrounding ambient air temperature. But when the stomata close due to water deficit, this evaporative cooling mechanism is shut down, causing the canopy temperature to rise significantly. By accurately measuring this increase in temperature relative to the ambient air temperature, agricultural scientists and hydrologists can quantitatively estimate the level of water stress a plant or an entire field is experiencing. This thermodynamic response forms the fundamental basis for thermal remote sensing in agriculture.
The Evolution of Landsat Thermal Infrared Sensors (TIRS)
The Landsat program, a joint initiative between the National Aeronautics and Space Administration (NASA) and the United States Geological Survey (USGS), has provided an uninterrupted, continuous record of Earth's land surface since 1972. While earlier missions like Landsat 5 and Landsat 7 included thermal bands, it was the introduction of the modern Thermal Infrared Sensor (TIRS) on Landsat 8 in 2013 and its improved successor on Landsat 9 in 2021 that truly transformed thermal remote sensing.
The TIRS instruments aboard Landsat 8 and 9 measure land surface temperature in two narrow thermal bands (Band 10 and Band 11) located in the atmospheric window between 10.6 and 12.5 micrometers. These dual bands allow for the application of advanced split-window algorithms, which help correct for atmospheric attenuation caused by water vapor and aerosols. The spatial resolution of TIRS data is collected at 100 meters per pixel, though it is often resampled and delivered at a 30-meter resolution to match the multispectral data from the Operational Land Imager (OLI). This relatively high spatial resolution is a critical advantage over other thermal sensors, such as MODIS or VIIRS, which offer thermal data at 1-kilometer or 375-meter resolutions, respectively. For agricultural monitoring, a 30-meter to 100-meter pixel allows researchers to analyze individual farm fields and center-pivot irrigation systems, providing actionable data at a scale that is meaningful to individual farmers and local water managers.
Understanding the Crop Water Stress Index (CWSI)
The Crop Water Stress Index (CWSI) was first introduced in the early 1980s by researchers Jackson, Idso, and their colleagues as a normalized metric to quantify plant water stress based on canopy temperature measurements. The index ranges from 0 to 1, where a value of 0 indicates a completely well-watered plant transpiring at its potential rate, and a value of 1 indicates a severely stressed plant whose transpiration has ceased entirely.
Fundamentally, the CWSI relates the observed difference between the canopy temperature (Tc) and the air temperature (Ta) to the theoretical maximum and minimum temperature differences that could occur under the given environmental conditions. To calculate the CWSI accurately, two critical baselines must be established: a "wet baseline" (representing a well-watered crop with maximum transpiration) and a "dry baseline" (representing a completely stressed crop with zero transpiration). The calculation of these baselines requires not only thermal data but also comprehensive meteorological parameters, including vapor pressure deficit (VPD), net radiation, air temperature, and wind speed.
Empirical vs. Analytical Approaches to CWSI
There are two primary methods for establishing the wet and dry baselines required for the CWSI calculation: the empirical approach and the analytical (or theoretical) approach.
The Empirical Approach
The empirical approach is relatively straightforward and relies heavily on direct field measurements. It involves plotting the observed canopy-to-air temperature difference (Tc - Ta) of a well-watered crop against the vapor pressure deficit (VPD) under specific climatic conditions. This relationship typically forms a linear wet baseline. The dry baseline is usually estimated as a constant value or a function of air temperature for a fully stressed crop. While the empirical approach is easier to implement, it is highly site-specific and crop-specific. An empirical baseline developed for corn in the American Midwest cannot be directly applied to wheat in the Australian outback without significant recalibration.
The Analytical Approach
The analytical approach, on the other hand, utilizes principles of the surface energy balance and aerodynamic resistance to calculate the theoretical wet and dry limits dynamically. This method, rooted in the Penman-Monteith equation, is much more robust and transferable across different regions and crop types because it explicitly accounts for variations in net radiation, aerodynamic resistance, and canopy resistance. By leveraging Landsat TIRS data in conjunction with gridded meteorological datasets (such as NLDAS or ERA5), researchers can calculate the analytical CWSI over vast geographical areas without the need for extensive localized field calibration.
Step-by-Step: Calculating CWSI using Landsat TIRS Data
Monitoring agricultural drought at scale requires a systematic processing pipeline to transform raw satellite digital numbers into a meaningful Crop Water Stress Index. The following steps outline the general workflow for deriving CWSI from Landsat 8/9 imagery.
Step 1: Data Acquisition and Preprocessing
The first step involves acquiring the necessary Landsat 8 or 9 Level-1 (or Level-2) data products from the USGS EarthExplorer or similar data repositories. It is crucial to select images with minimal cloud cover, especially over the agricultural regions of interest. Preprocessing steps include converting the raw digital numbers (DN) to Top of Atmosphere (TOA) radiance and subsequently to at-sensor brightness temperature. For accurate agricultural analysis, atmospheric correction must be applied to the multispectral bands to obtain surface reflectance, which is needed to calculate vegetation indices.
Step 2: Deriving Land Surface Temperature (LST)
Retrieving accurate Land Surface Temperature (LST) is the most critical step in this workflow. The brightness temperature obtained from the TIRS bands must be corrected for surface emissivity. Surface emissivity is a measure of an object's efficiency in emitting thermal energy and varies depending on land cover, vegetation density, and soil moisture. Emissivity can be estimated using the Fractional Vegetation Cover (FVC), which is derived from the Normalized Difference Vegetation Index (NDVI) calculated using the red and near-infrared bands of the OLI sensor. Once emissivity is determined, the Radiative Transfer Equation (RTE) or a split-window algorithm is applied to calculate the final LST.
Step 3: Estimating Canopy Temperature
In a typical 30-meter Landsat pixel over an agricultural field, the sensor observes a mixture of crop canopy and bare soil. Because dry soil can be significantly hotter than the crop canopy, this mixed-pixel effect can artificially inflate the estimated canopy temperature, leading to an overestimation of water stress. Various unmixing techniques, such as the Two-Source Energy Balance (TSEB) model, are employed to partition the observed LST into its constituent soil and canopy components. Alternatively, researchers may focus their analysis on fields with full canopy closure (e.g., NDVI > 0.7), where the soil background effect is minimal.
Step 4: Integrating Meteorological Data
To compute the wet and dry baselines, high-quality meteorological data concurrent with the satellite overpass time (approximately 10:00 AM to 10:30 AM local solar time) is essential. Parameters such as air temperature, relative humidity (used to calculate VPD), wind speed, and solar radiation are obtained from local weather station networks (e.g., CIMIS in California, or Mesonet systems) or from gridded reanalysis datasets. These meteorological variables are spatially interpolated to match the resolution of the Landsat grid.
Step 5: Final CWSI Computation
With the canopy temperature (Tc) derived from Landsat LST, the air temperature (Ta), and the established wet (T_wet) and dry (T_dry) baselines, the CWSI is calculated for each pixel using the formula:
CWSI = (Tc - T_wet) / (T_dry - T_wet)
The resulting CWSI map provides a spatially explicit representation of crop water stress across the landscape. Values closer to 0 indicate healthy, transpiring crops, while values approaching 1 highlight areas suffering from severe drought and water deficit.
Scaling Up: Monitoring Agricultural Drought at Scale
The true power of integrating Landsat TIRS data with the CWSI framework lies in the ability to monitor agricultural drought at scale. Traditional methods of assessing crop water stress rely on point measurements using handheld infrared thermometers, leaf porometers, or soil moisture probes. While highly accurate, these methods are labor-intensive, time-consuming, and entirely impractical for monitoring hundreds of thousands of hectares of farmland. Satellite remote sensing bridges this gap by providing a synoptic view of the landscape.
By automating the CWSI processing pipeline using cloud computing platforms such as Google Earth Engine (GEE), Amazon Web Services (AWS), or Microsoft Planetary Computer, researchers and government agencies can process petabytes of Landsat data in near real-time. This scalable approach allows for the generation of regional, national, or even global drought monitor products.
For example, irrigation districts can use time-series CWSI maps to identify fields that are consistently underperforming, enabling targeted interventions and more efficient water allocations during times of scarcity.
The Role of CWSI in Precision Agriculture
Precision agriculture aims to optimize field-level management regarding crop farming. The high spatial resolution of Landsat 8 and 9 makes CWSI a highly valuable metric for precision irrigation management. Instead of applying water uniformly across an entire field, a practice that often leads to over-watering in some areas and under-watering in others, farmers can use CWSI maps to implement Variable Rate Irrigation (VRI). VRI systems adjust the amount of water applied based on the specific needs of different management zones within the field.
Also, early detection of water stress through thermal imaging provides farmers with a critical window of opportunity. Because physiological changes (like stomatal closure and increased temperature) occur days or even weeks before visible symptoms (like wilting or yellowing of leaves) manifest, CWSI allows for proactive rather than reactive irrigation management. This proactive approach can prevent irreversible yield losses and maximize crop water productivity.
Challenges and Limitations in Thermal Remote Sensing
Despite the immense potential of monitoring agricultural drought using landsat thermal infrared sensor data, several challenges and limitations must be acknowledged and addressed by practitioners.
Cloud Cover and Temporal Resolution
The most significant limitation of optical and thermal remote sensing is cloud cover. Thermal sensors cannot penetrate clouds, meaning that data acquisition is heavily dependent on clear skies. Also, Landsat 8 and 9 each have a 16-day revisit cycle. When phased together, they provide an 8-day revisit time. But in regions with frequent cloud cover, it may take weeks to obtain a clear image. During rapidly developing "flash droughts," an 8-day or 16-day gap between observations may be too long to capture the onset of severe water stress, potentially limiting the utility of the data for real-time irrigation scheduling.
Spatial Resolution vs. Field Size
While the 30-meter resampled resolution of Landsat thermal data is excellent for large-scale commodity crops (e.g., corn, soybeans, wheat), it may be insufficient for monitoring smallholder farms or highly heterogeneous landscapes. In developing nations where farm plots are often smaller than a single Landsat pixel, the mixed-pixel effect becomes a dominant source of error. In these scenarios, researchers must explore data fusion techniques, combining Landsat thermal data with high-resolution imagery from commercial satellites, drones (UAVs), or employing sharpening algorithms to enhance the spatial resolution.
Complexities of the Soil Background
As previously mentioned, bare soil can severely contaminate the thermal signal of the canopy, especially during the early stages of crop growth when canopy cover is sparse. Accounting for the soil background requires complex modeling (e.g., TSEB) and high-quality auxiliary data. Errors in estimating surface emissivity or partitioning the soil and canopy temperatures can lead to significant inaccuracies in the final CWSI calculation, potentially resulting in false alarms or missed drought events.
Case Studies and Real-World Applications
The application of Landsat-derived CWSI is not merely a theoretical exercise; it has been successfully deployed in numerous regions around the world to combat the impacts of drought.
California's Central Valley
In California's Central Valley, one of the most productive agricultural regions in the world, recurring multi-year droughts have forced the implementation of strict groundwater management policies (e.g., SGMA). Researchers and state agencies have utilized Landsat thermal data to calculate both CWSI and actual evapotranspiration (ETa). These metrics are used to monitor agricultural water consumption at the field level, verify compliance with water allocations, and assess the severity of drought impacts on high-value permanent crops like almonds, pistachios, and vineyards.
The Murray-Darling Basin, Australia
Australia is heavily impacted by the El Nino Southern Oscillation (ENSO), which frequently induces severe droughts across the continent. In the Murray-Darling Basin, the agricultural heartland of Australia, CWSI derived from Landsat imagery has been integrated into national drought monitoring frameworks. By analyzing historical Landsat archives dating back to the late 1980s, scientists have established long-term baselines of crop performance, allowing them to contextualize current drought events against historical extremes and inform government drought relief programs.
Future Outlook: The Road to Landsat Next
The future of thermal remote sensing for agricultural monitoring is incredibly promising. NASA and the USGS are actively developing the next generation of Earth observation satellites, known as Landsat Next, slated for launch in the early 2030s. The Landsat Next constellation is expected to feature a significant leap in capabilities, including an improved spatial resolution of 10 to 20 meters and a dramatically reduced revisit time, potentially providing observations every few days.
This increased temporal frequency will directly address one of the primary limitations of the current Landsat system, enabling the near real-time monitoring of crop water stress and the rapid detection of flash droughts. Also, the integration of Landsat data with other international satellite missions, such as the European Space Agency's Copernicus Sentinel-8 (LSTM - Land Surface Temperature Monitoring) and the TRISHNA mission (a joint effort between France and India), will create a global, high-resolution thermal imaging network. This interconnected system will provide agronomists and hydrologists with an unparalleled wealth of data, pushing the boundaries of what is possible in precision agriculture and drought management.
Integrating Artificial Intelligence and Machine Learning
As the volume of satellite data continues to grow exponentially, the integration of Artificial Intelligence (AI) and Machine Learning (ML) techniques is becoming increasingly vital. Traditional physically-based models for calculating CWSI are computationally intensive and require numerous meteorological inputs that may not be available globally. Researchers are now developing ML algorithms, such as Random Forests, Support Vector Machines, and deep Convolutional Neural Networks (CNNs), to predict crop water stress directly from Landsat multispectral and thermal bands.
These ML models can be trained on vast datasets of historical CWSI calculations, eddy covariance flux tower measurements, and soil moisture networks. Once trained, these algorithms can rapidly estimate water stress across large regions without the need for complex, pixel-by-pixel energy balance calculations. The fusion of high-resolution Landsat TIRS data with advanced machine learning represents a major frontier in the quest to automate and streamline global agricultural drought monitoring.
Policy Implications and Water Governance
The ability to map and quantify crop water stress at a highly granular level has profound implications for water governance and agricultural policy. In regions facing chronic water scarcity, regulators can use Landsat-derived CWSI and evapotranspiration data to design and enforce more equitable and sustainable water use policies.
For example, water trading markets can be facilitated by providing objective, satellite-based verification of water savings. Farmers who successfully reduce their water consumption without severely stressing their crops (as verified by CWSI) can sell their surplus water rights, creating a financial incentive for conservation.
Plus, accurate drought monitoring is essential for agricultural insurance programs. Parametric insurance schemes can utilize satellite-derived indices like CWSI to automatically trigger payouts to farmers when predefined stress thresholds are exceeded over a sustained period. This eliminates the need for slow and costly field inspections, providing farmers with rapid financial relief during catastrophic drought events.
Conclusion
As the global population approaches 10 billion and climate change exacerbates the unpredictability of water resources, optimizing agricultural production is paramount. The continuous observation of the Earth's surface provided by the Landsat program is an invaluable asset in this endeavor. Specifically, monitoring agricultural drought using landsat thermal infrared sensor data provides a robust, scientifically validated approach to assessing crop health and managing water resources at scale.
By leveraging the dual thermal bands of the TIRS instrument on Landsat 8 and 9, researchers can accurately calculate the Crop Water Stress Index, transforming raw satellite imagery into actionable intelligence for farmers, hydrologists, and policymakers. While challenges remain regarding cloud cover, spatial resolution in fragmented landscapes, and the complexities of soil-canopy unmixing, ongoing advancements in satellite technology, cloud computing, and machine learning are rapidly overcoming these hurdles. As we look forward to the launch of Landsat Next and other high-resolution thermal missions, the integration of satellite-based drought monitoring into everyday agricultural management will become increasingly seamless, ensuring a more resilient and food-secure future for our planet.
Frequently Asked Questions
How does Landsat TIRS monitor agricultural drought?
Landsat's Thermal Infrared Sensor (TIRS) measures land surface temperatures (LST). High temperatures combined with low vegetative vigor often indicate plant water stress, a key early warning sign of agricultural drought.
What is the Evaporative Stress Index (ESI)?
The Evaporative Stress Index (ESI) describes temporal anomalies in evapotranspiration. It compares actual evapotranspiration rates to potential rates to reveal regions where crops are suffering from moisture deficits.
Why use thermal remote sensing instead of optical for drought?
Thermal remote sensing detects temperature spikes caused by reduced plant transpiration long before physical changes (like browning or wilting) become visible in standard optical or near-infrared bands.
