Remote Sensing in Agriculture: Understanding NDVI
Table of Contents
- What is Remote Sensing in Agriculture?
- Active vs. Passive Remote Sensing Systems
- Decoding NDVI: The Normalized Difference Vegetation Index
- The Science Behind the Index: Light, Chlorophyll, and Plant Health
- The NDVI Formula Explained
- Interpreting the NDVI Scale for Precision Agriculture
- The Core Applications of NDVI in Modern Farming
- 1. Proactive Crop Health Monitoring and Directed Scouting
- 2. Optimizing Variable Rate Application (VRA) of Inputs
- 3. Drought Detection and Precision Irrigation Management
- 4. Yield Prediction and Macro-Biomass Estimation
- Sources of NDVI Data: From Space to Soil
- Satellite Imagery: The Macro, Whole-Farm Perspective
- Unmanned Aerial Vehicles (UAVs) and Drones: The Micro, Plant-Level Perspective
- Ground-Based and Tractor-Mounted Optical Sensors
- Advantages and Limitations of Using NDVI
- Why NDVI is the Undisputed Industry Standard
- The Critical Limitations: Saturation and Atmospheric Interference
- Complementary Vegetation Indices for Advanced Analytics
- Step-by-Step Guide: Implementing NDVI in Your Agricultural Workflow
- The Future of Remote Sensing in Agriculture
- Conclusion
- Frequently Asked Questions
rsandgis.me
The dawn of the 21st century has brought about a profound transformation in how we produce food, fiber, and fuel. At the heart of this agricultural revolution lies a suite of technologies collectively known as precision agriculture. Among these, remote sensing in agriculture stands out as a foundational pillar, enabling farmers, agronomists, and researchers to observe, measure, and respond to inter-field and intra-field variability in crops. Instead of relying purely on intuition, historical average data, or exhaustive ground scouting, modern agriculture leverages the immense power of the electromagnetic spectrum to diagnose plant health from miles above the Earth's surface. One metric, above all others, has become the industry standard for quantifying this health and vigor: the Normalized Difference Vegetation Index, commonly known as NDVI.
Whether you are managing a family-owned farm, overseeing tens of thousands of acres for a commercial agribusiness, or researching climate-resilient crops at a university, understanding NDVI is no longer optional—it is a critical and foundational competency. This comprehensive, deep-dive guide explores the intricate intersection of remote sensing in agriculture and NDVI. We will thoroughly investigate the physics of light absorption, the mathematical formulations of vegetation indices, the practical applications of NDVI in day-to-crop management, the vast array of platforms used to gather data, and the exciting future of satellite-driven agronomy powered by artificial intelligence. By the end of this extensive article, you will have a masterful understanding of how to leverage NDVI to optimize crop yields, reduce costly input waste, and promote long-term environmental sustainability.
What is Remote Sensing in Agriculture?
Before diving into the intricate specifics of NDVI, it is absolutely essential to establish a firm understanding of what remote sensing in agriculture entails. In its broadest and most technical definition, remote sensing is the science and art of obtaining quantitative and qualitative information about an object, area, or phenomenon through the analysis of data acquired by a device that is not in physical contact with the object under investigation. In the context of agriculture, this translates to utilizing advanced optical and thermal sensors mounted on satellites orbiting in space, aircraft flying in the stratosphere, drones (UAVs) hovering over fields, or even high-clearance tractors driving through the crop rows to capture imagery and data about crop canopy and soil conditions.
These sophisticated sensors operate by detecting, measuring, and recording electromagnetic radiation that is either reflected or emitted from the Earth's surface. The human eye is a remarkable organ, but it can only perceive a tiny, narrow sliver of the entire electromagnetic spectrum—the visible light range (spanning approximately from 400 to 700 nanometers). However, plants interact with light far beyond this visible spectrum. By utilizing advanced multispectral and hyperspectral sensors, remote sensing technology allows us to essentially "see" in the near-infrared (NIR), shortwave infrared (SWIR), and thermal infrared bands. This non-visible data is where the true diagnostic and predictive power of remote sensing in agriculture lies, revealing early signs of physiological crop stress, disease outbreaks, severe nutrient deficiencies, and subtle water shortages days or even weeks before they manifest as visible, irreversible symptoms like yellowing (chlorosis), browning (necrosis), or structural wilting.
Active vs. Passive Remote Sensing Systems
To fully appreciate the scope of remote sensing in agriculture, one must understand that the technology generally falls into two distinct categories based on how energy is sourced:
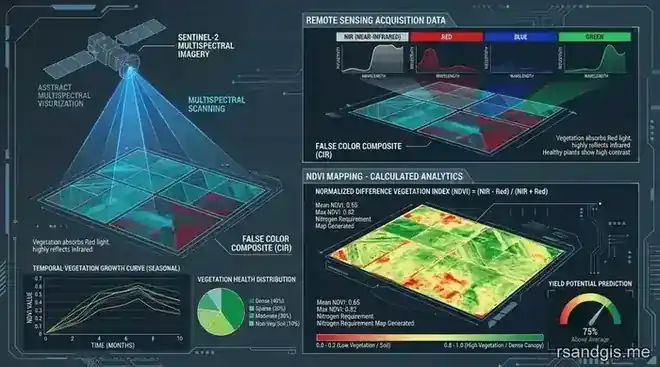
- Passive Remote Sensing: These systems measure naturally occurring energy that is reflected or emitted from the agricultural target. The most common, ubiquitous source of this energy is sunlight. Passive sensors capture the solar radiation bouncing off the plant canopy. NDVI is almost exclusively calculated using data captured from passive multispectral sensors (such as the cameras on Landsat or Sentinel satellites). The downside is that they require sunlight and cannot see through thick cloud cover.
- Active Remote Sensing: In contrast, these systems provide their own independent source of energy to illuminate the target. The sensor emits a directed pulse of electromagnetic radiation—such as Light Detection and Ranging (LiDAR) or Synthetic Aperture Radar (SAR)—and measures the backscattered signal that returns to the sensor. While less commonly used for calculating standard vegetation indices like NDVI, active sensors are invaluable in agriculture for penetrating dense cloud cover (a huge advantage of SAR), accurately measuring crop height, assessing complex 3D biomass structure, and estimating soil moisture beneath the canopy.
Decoding NDVI: The Normalized Difference Vegetation Index
Among the dozens of specialized vegetation indices developed by remote sensing scientists and agronomists over the past fifty years, the Normalized Difference Vegetation Index (NDVI) remains the most widely adopted, exhaustively researched, and universally recognized. Introduced in the 1970s alongside the launch of the early NASA Landsat satellites, NDVI was initially designed to separate the "greenness" of vegetation from the background brightness of the soil. But what exactly is NDVI, and why does this specific ratio work so incredibly well for agriculture?
The Science Behind the Index: Light, Chlorophyll, and Plant Health
To truly grasp the foundational concept of NDVI, we must look at cellular biology and how plant leaves interact with incoming solar radiation. A healthy, actively growing, and photosynthesizing plant leaf absorbs, transmits, and reflects light in very specific, predictable, and measurable ways:
- Visible Red Light (approximately 600-700 nm): Chlorophyll, the primary green pigment responsible for driving photosynthesis, heavily absorbs visible red light. The plant actively uses this energy to convert carbon dioxide and water into glucose (food) and oxygen. Therefore, a healthy plant with an abundance of active chlorophyll will absorb most of the red light and reflect very little of it back into the atmosphere toward a remote sensing sensor.
- Near-Infrared Light (NIR) (approximately 700-1300 nm): Unlike visible light, near-infrared energy cannot be used for photosynthesis. In fact, if a plant were to absorb too much NIR energy, it would rapidly overheat, causing irreversible tissue damage and protein denaturation. Through millions of years of evolutionary adaptation, the internal spongy mesophyll cellular structure of healthy plant leaves reflects the vast majority of incoming NIR energy.
When a plant becomes stressed—whether that stress is induced by severe drought, an aggressive pest infestation, a rapidly spreading fungal disease, or a critical macro-nutrient deficiency (like Nitrogen or Phosphorus)—its physiological and structural integrity changes. The chlorophyll begins to degrade, leading to a significant decrease in the absorption of red light (hence why stressed, dying plants often look yellow or pale). Simultaneously, the internal spongy mesophyll cellular structure breaks down and collapses, causing a drastic decrease in the reflectance of near-infrared light. NDVI exploits this precise, inverse, and highly correlated relationship between red light absorption and NIR reflectance.
The NDVI Formula Explained
The profound beauty and lasting utility of NDVI lie in its mathematical elegance and simplicity. By creating a normalized ratio of the difference between near-infrared and red reflectance, we obtain a single, dimensionless numerical value that accurately represents plant vigor, density, and health. The globally standardized formula is as follows:
NDVI = (NIR - RED) / (NIR + RED)
Where:
- NIR: Represents the spectral reflectance captured in the near-infrared band of the electromagnetic spectrum.
- RED: Represents the spectral reflectance captured in the visible red band of the electromagnetic spectrum.
Because the equation is normalized (meaning the difference is divided by the sum of the two bands), the resulting NDVI value will always strictly fall on a fixed mathematical scale between -1.0 and +1.0. This normalization step is absolutely crucial for reliable remote sensing in agriculture because it naturally compensates for and cancels out variations in external illumination conditions. Whether the image is taken under a bright noon sun, at a lower sun angle in the afternoon, or across varying hilly topography that casts shadows, the normalized ratio ensures that the index remains mathematically consistent and directly comparable over time and across different geographic regions.
Interpreting the NDVI Scale for Precision Agriculture
Understanding how to read, interpret, and contextualize the NDVI scale is the very first step in translating raw, pixelated remote sensing data into actionable, profitable agronomic insights. While the exact threshold values can vary slightly depending on the specific crop type (e.g., corn vs. soybeans vs. vineyards), the distinct growth stage (phenology), and the specific sensor calibration used, the general, widely accepted interpretation for agricultural landscapes is as follows:
| NDVI Value Range | Typical Surface Cover Interpretation | Agronomic Context and Actionable Insights |
|---|---|---|
| -1.0 to 0.0 | Water bodies, Snow, Ice, Thick Clouds, Artificial Surfaces (roads, buildings) | Represents non-agricultural or totally barren areas. In a field map context, persistent values in this range might indicate severely flooded zones, deep waterlogging, or areas completely washed out by heavy rainfall where intervention is impossible. |
| 0.0 to 0.15 | Bare Soil, Rock, Sand, Deep Tillage | Typically indicates pre-emergence fields, recently tilled soil, or completely barren patches where crop establishment has catastrophically failed due to poor germination, soil crusting, or extreme salinity. |
| 0.15 to 0.35 | Sparse Vegetation, Shrubs, Weeds, or Severely Stressed Crops | Represents the early emergence stages of crops (V1-V3 in corn), or mid-season areas suffering from severe blight, catastrophic pest devastation, or profound, yield-limiting drought. Demands immediate scouting. |
| 0.35 to 0.65 | Moderate Vegetation, Mid-season Actively Growing Crops | Actively growing crops in their vegetative stages. Lower values within this tier compared to the rest of the field may indicate emerging localized nutrient deficiencies or early-onset water stress, serving as an early warning for fertilizer application. |
| 0.65 to 1.0 | Dense, Healthy Canopy, Forests, Peak Season High-Yielding Crops | Indicates maximum chlorophyll activity and peak biomass accumulation. Represents the healthiest, most productive, and high-yielding zones of the field approaching full canopy closure. Minimal intervention required. |
The Core Applications of NDVI in Modern Farming
The true, transformative value of remote sensing in agriculture is realized when indices like NDVI are integrated directly into a farm's daily operational workflows to solve real-world, complex farming challenges. By integrating NDVI maps into a centralized Farm Management Information System (FMIS), growers can systematically transition from reactive, intuition-based farming to proactive, precision-driven, data-backed agriculture.
1. Proactive Crop Health Monitoring and Directed Scouting
Traditionally, crop scouting involved an agronomist physically walking or driving ATVs through fields in a predetermined pattern (often a "W" or "Z" shape) to look for visual signs of trouble. In vast modern farming operations covering thousands or tens of thousands of acres, this legacy method is incredibly labor-intensive, time-consuming, expensive, and highly prone to missing localized, early-stage issues hiding deep within the canopy. NDVI acts as an omnipresent eye in the sky, instantly highlighting anomalies across thousands of acres simultaneously.
Because NDVI can detect microscopic changes in chlorophyll absorption and cellular structure before the human eye can perceive a change in color, it serves as an unparalleled early warning system. If a specific, two-acre zone of a massive cornfield shows a sudden, unexplained drop in NDVI mid-season while the rest of the field thrives, the farmer knows exactly where to direct their scouts. Instead of aimlessly walking the entire field, the scout utilizes GPS to navigate directly to the low-NDVI anomaly to diagnose the root cause—verifying whether it is a localized nematode infestation, a malfunctioning irrigation nozzle, a rapidly spreading fungal rust, or a localized nitrogen washout. This "directed scouting" saves hundreds of man-hours and catches yield-destroying threats before they spread.
2. Optimizing Variable Rate Application (VRA) of Inputs
One of the most economically lucrative and environmentally impactful applications of NDVI is enabling and driving Variable Rate Technology (VRT). Historically, farmers applied agricultural inputs—like synthetic fertilizers, chemical herbicides, fungicides, and growth regulators—at a flat, uniform rate across an entire field. This "blanket application" approach inevitably means that some areas of the field receive too much input (wasting expensive chemicals and severely risking nutrient runoff and leaching into local watersheds and groundwater), while other areas receive too little (starving the plants and severely limiting the field's overall yield potential).
NDVI maps are the foundational data layer used to create intelligent prescription maps for Variable Rate Application. By utilizing GIS software to stratify a field into distinct, statistically significant management zones based on historical and current NDVI vitality, farmers can execute highly targeted interventions:
- Nitrogen and Fertilizer Management: High NDVI zones generally indicate sufficient nitrogen and vigorous growth, allowing the farmer to confidently reduce application rates and save money. Conversely, moderately low NDVI zones might indicate nitrogen stress, where an aggressive, targeted top-dress application will provide the highest return on investment (ROI) by rescuing the yield potential.
- Pesticide and Fungicide Targeting: If an NDVI time-series reveals that a crop disease (like late blight in potatoes) is localized strictly to one humid, low-lying corner of a field, chemical sprays can be targeted precisely to that quarantine area, drastically reducing chemical costs, mitigating resistance buildup, and lowering the environmental impact footprint.
- Desiccation and Defoliation Timings: In crops requiring pre-harvest chemical treatments like cotton or potatoes, late-season NDVI maps perfectly visualize the varying maturity and senescence levels across the field. This helps determine the optimal timing and variable rate for chemical desiccants, ensuring a uniform, highly efficient harvest.
3. Drought Detection and Precision Irrigation Management
Global water scarcity is arguably one of the most pressing and existential challenges facing modern global agriculture. Remote sensing in agriculture plays a critically vital role in optimizing agricultural water use and adapting to changing climate patterns. While NDVI is technically a measure of greenness and biomass rather than direct leaf moisture content, severe water stress rapidly and predictably manifests as a measurable drop in plant vigor, which NDVI accurately and quickly captures.
When combined with complementary thermal infrared imagery (which measures canopy temperature—stressed, thirsty plants close their stomata to conserve water, halting transpiration and causing the leaf to heat up), NDVI provides an incredibly robust, multi-layered framework for Variable Rate Irrigation (VRI). Massive center pivot irrigation systems equipped with VRI technology can be dynamically programmed using fused NDVI and thermal maps. This allows the system to speed up and apply less water over low-lying, high-clay soils that naturally retain moisture (preventing waterlogging and root rot), while simultaneously slowing down to apply heavier water doses to sandy, well-drained, low-NDVI zones that dry out rapidly. This maximizes "crop per drop" water use efficiency.
4. Yield Prediction and Macro-Biomass Estimation
Accurately estimating crop yield months prior to the actual harvest is absolutely crucial for complex logistics planning, grain marketing, securing crop insurance, and ensuring accurate financial cash-flow forecasting. Decades of agronomic research have demonstrated incredibly strong mathematical correlations between the cumulative NDVI values integrated over the entire growing season (particularly during critical reproductive and grain-filling stages, such as the silking stage in corn or the heading stage in wheat) and the final, weigh-wagon harvestable yield.
By comparing the current season's NDVI growth trajectories with vast databases of historical yield data, machine-learning-driven agronomic models can accurately estimate total biomass accumulation and project end-of-season yields with remarkable precision. This spatial estimation allows farmers to vividly identify their consistently highest-performing and lowest-performing field zones year after year, fundamentally informing long-term strategic decisions about land rental negotiations, optimizing crop rotation schedules, and directing capital investments (like installing subsurface tile drainage in chronically low-yielding, low-NDVI waterlogged zones).
Sources of NDVI Data: From Space to Soil
The rapid democratization and commercialization of remote sensing in agriculture has resulted in a vast ecosystem of platforms capable of generating high-quality NDVI data. Selecting the right platform depends entirely on the required spatial resolution (how finely detailed the image pixels are), the temporal resolution (how frequently the data is collected over the same spot), and the operational budget.
Satellite Imagery: The Macro, Whole-Farm Perspective
Satellites offer the most expansive, cost-effective, and historically rich datasets for NDVI analysis. They are the absolute ideal choice for large-scale farm management, regional yield forecasting, and analyzing historical field performance over decades.
- Landsat 8 & 9 (NASA/USGS): Providing a standard 30-meter spatial resolution and returning to image the same spot on Earth every 8 days (when the orbits of 8 and 9 are combined). The Landsat program is the undisputed gold standard for historical NDVI analysis, boasting an unparalleled, continuous archive that stretches back to the 1970s, making it invaluable for long-term climate and agricultural trend analysis.
- Sentinel-2 (European Space Agency - Copernicus): A true game-changer for modern agriculture, offering a highly detailed 10-meter spatial resolution in the critical red and NIR bands, with an impressive revisit time of roughly 5 days. Sentinel-2 provides an absolutely exceptional balance of detail and frequency, and incredibly, the data is available completely free of charge to researchers, farmers, and software developers worldwide.
- Commercial Nanosatellite Constellations (e.g., Planet Labs, Maxar): Commercial space companies operate massive constellations of "nanosatellites" (like Planet's Dove network) that can capture imagery of the entire Earth's agricultural landmass daily at a remarkable, sub-3-meter resolution. This ultra-high temporal resolution ensures that even in notoriously cloudy agricultural regions (like the US Corn Belt in spring or Northern Europe), farmers receive a constant, uninterrupted stream of usable, cloud-free NDVI data.
Unmanned Aerial Vehicles (UAVs) and Drones: The Micro, Plant-Level Perspective
When satellite data is inevitably obscured by prolonged cloud cover, or when a precision agriculturalist requires sub-centimeter, ultra-high resolution to evaluate individual plants or rows, drones are the undisputed platform of choice. Equipped with miniaturized, specialized multispectral cameras (like the industry-standard sensors from MicaSense or DJI), drones fly autonomously just a few hundred feet above the crop canopy.
Drone-based NDVI is incredibly precise and granular. It can be used to accurately execute automated plant stand counts in early-stage crops, identify specific invasive weed species based on their unique spectral signatures growing between the crop rows, and conduct meticulous phenotyping for agricultural breeding research plots. The primary drawbacks are the high initial capital cost, the regulatory hurdles of commercial drone flight, and the massive computational power and time required to stitch together thousands of individual high-res images into a single, seamless orthomosaic field map.
Ground-Based and Tractor-Mounted Optical Sensors
To overcome atmospheric interference and cloud cover entirely, some of the most effective remote sensing tools are brought straight down to the earth. Tractor-mounted active optical sensors (such as the Trimble GreenSeeker or Ag Leader OptRx) emit their own modulated light source and measure the NDVI of the crop canopy in real-time as the tractor drives over it.
These robust systems are typically integrated directly into the control systems of liquid fertilizer sprayers or dry granular spreaders, enabling true real-time, "on-the-go" Variable Rate Application. The sensor reads the NDVI of the crop directly beneath it, the onboard computer instantly calculates the required nitrogen rate based on a pre-programmed algorithm, and the spreader mechanically adjusts its output instantly—all occurring seamlessly in a fraction of a second at 15 miles per hour.
Advantages and Limitations of Using NDVI
While NDVI is a profoundly powerful and transformative tool, a truly mature, nuanced understanding of remote sensing in agriculture requires acknowledging both its tremendous strengths and its inherent mathematical and physical limitations.
Why NDVI is the Undisputed Industry Standard
The primary advantage of NDVI is its universal applicability, ease of calculation, and incredibly robust historical precedent. Because the formula is a simple mathematical ratio, it effectively normalizes and cancels out linear optical noise caused by variations in solar angle, undulating topography, or minor atmospheric haziness. Furthermore, because it relies on the universally captured Red and NIR bands, virtually every multispectral sensor manufactured in the last forty years can effortlessly produce NDVI, ensuring unparalleled cross-platform compatibility and software integration.
The Critical Limitations: Saturation and Atmospheric Interference
Despite its widespread and ubiquitous use, NDVI is not a flawless, magical metric. Agronomists must be acutely aware of its blind spots:
- The Late-Season Saturation Effect: In incredibly dense, multi-layered, highly productive crop canopies (such as late-stage irrigated corn, mature soybeans, or dense tropical plantation crops), the Leaf Area Index (LAI) becomes so high that the upper layers of the plant canopy absorb almost 100% of the incoming red light. Once red reflectance drops to near zero, the NDVI equation mathematically "maxes out" or saturates, often stubbornly hovering around 0.85 to 0.95. At this point, NDVI completely loses its sensitivity. If the crop health miraculously increases further, or biomass continues to rapidly accumulate beneath the top canopy, the NDVI value will not reflect this continued growth, making it a poor tool for late-season nitrogen management in high-yielding environments.
- Soil Background Noise: In the early growth and emergence stages when the crop canopy is sparse and open (low LAI), the bare soil completely dominates the sensor's field of view. Variations in soil moisture (wet dark soil vs dry light soil), soil organic matter content, and natural soil color can significantly skew the NDVI reading, making it difficult to isolate the true health of the tiny emerging plants from the noisy background of the dirt.
- Atmospheric Attenuation: While the NDVI ratio partially corrects for minor illumination issues, heavy aerosols, thick wildfire smoke, humidity, or thin, invisible cirrus clouds can scatter NIR and red light differently as it travels back to the satellite, resulting in artificially lowered, noisy NDVI values that can trigger false alarms in farm management software.
Complementary Vegetation Indices for Advanced Analytics
To overcome these inherent limitations, sophisticated agronomists and advanced remote sensing software platforms often employ alternative, highly specialized indices alongside NDVI to get a complete picture:
- SAVI (Soil Adjusted Vegetation Index): Ingeniously incorporates a mathematically derived soil brightness correction factor (L) into the equation to specifically minimize soil background influence in early-stage, sparsely vegetated crops, providing a much truer reading of early plant vigor.
- EVI (Enhanced Vegetation Index): A complex index that utilizes the blue light band (in addition to Red and NIR) to aggressively mathematically correct for atmospheric aerosols and further adjust for soil background. Crucially, EVI remains highly sensitive and dynamic in high-biomass, dense canopy regions where standard NDVI utterly fails and saturates.
- NDRE (Normalized Difference Red Edge): Replaces the standard visible Red band in the equation with the "Red Edge" band (a very narrow, highly sensitive transition zone of light directly between Red and NIR). NDRE penetrates much deeper into dense, multi-layered canopies, making it vastly superior to standard NDVI for late-season nitrogen management and identifying subtle, deep-canopy stress in mature, high-yielding crops.
Step-by-Step Guide: Implementing NDVI in Your Agricultural Workflow
Adopting NDVI and the broader concepts of remote sensing in agriculture is not just about looking at pretty colored maps; it requires a systematic, integrated agronomic approach. Here is exactly how cutting-edge modern farms integrate this technology into their daily, seasonal operations to drive massive ROI:
- Automated Data Acquisition: The farm manager utilizes a modern, cloud-based Farm Management Information System (FMIS) (such as Climate FieldView, John Deere Operations Center, Granular, or Farmers Edge) that automatically ingests satellite imagery via API from Sentinel-2 or commercial constellations in the background.
- Algorithmic Cloud Masking and Pre-processing: The software's advanced machine learning algorithms automatically detect and rigorously remove pixels obscured by clouds, cloud shadows, or haze, ensuring that only pure, clear data is analyzed. The raw reflectance data is then instantly converted into a calibrated NDVI layer.
- Intelligent Zoning and Stratification: The field is visually represented on the farmer's iPad or computer as a color-coded map (often utilizing an intuitive traffic-light scale: deep red for critically low NDVI, yellow for medium/average, dark green for exceptionally high vigor). The software can automatically segment the field mathematically into 3 to 5 distinct, highly accurate "management zones" based on these clustered values.
- Ground Truthing (Directed Scouting): This is arguably the most important step in the entire workflow. NDVI does not tell you why a plant is stressed, it only tells you that it is stressed. The agronomist or crop consultant takes the NDVI map out to the field (via a mobile app with live GPS tracking) and navigates directly to the lowest-performing zones to visually diagnose the root issue (e.g., verifying a spider mite outbreak, locating a blocked drainage tile, or pulling targeted soil samples to check pH and macro-nutrient levels).
- Action and Variable Application: Once the exact agronomic cause is positively identified, the farm manager uses the software to create a digital prescription map (Rx map). This shapefile is loaded via USB or wireless transfer into the tractor's cab monitor. As the tractor drives across the field, the computer seamlessly adjusts the variable rate applicator on the go, directing expensive chemical resources precisely where the NDVI map dictates they are most needed, and withholding them where they are not.
- Post-Harvest Yield Review and ROI Analysis: At the end of the grueling harvest season, the historical NDVI maps are digitally overlaid with actual, highly accurate yield data recorded by the combine harvester's yield monitor. This rigorous spatial analysis allows the farmer to assess the true financial ROI of their variable rate applications and continuously refine, improve, and train their management strategies for the following growing season.
The Future of Remote Sensing in Agriculture
The widespread adoption and integration of standard NDVI is merely the opening chapter in the precision agriculture journey. The future of remote sensing in agriculture is rapidly and exponentially expanding far beyond basic, legacy multispectral indices.
The immediate next frontier is the widespread commercialization of Hyperspectral Imaging from space. While traditional multispectral sensors (like those on Sentinel-2) capture data in 4 to 10 broad bands of light, cutting-edge hyperspectral sensors capture data across hundreds of incredibly narrow, contiguous spectral bands. This creates a highly detailed, uniquely identifiable "spectral fingerprint" for the field. Instead of just indicating general, vague stress via a low NDVI score, hyperspectral data can pinpoint exactly which specific fungal disease is present, or remotely quantify the exact parts-per-million concentration of nitrogen, phosphorus, and potassium within the leaf tissue directly from orbit.
Furthermore, the explosive convergence of artificial intelligence (AI), deep learning neural networks, and remote sensing is fully automating the analytical process. Advanced algorithms are currently being trained on vast, petabyte-scale datasets combining decades of historical NDVI, hyper-local weather patterns, highly detailed soil type maps, and massive amounts of yield data to build incredibly accurate predictive models. In the very near future, AI-driven farm management systems will not just highlight a low-NDVI zone after the fact; they will accurately predict the onset of a specific disease based on early spectral signature shifts and microclimate data, and automatically order the exact chemical fungicide required to combat it before the farmer ever sets foot in the field, optimizing logistics and protecting yields autonomously.
Conclusion
The global human population is projected to reach nearly 10 billion by the year 2050, necessitating a massive, unprecedented increase in global food production on a steadily shrinking footprint of viable arable land and dwindling freshwater resources. To successfully meet this monumental, existential challenge, the entire global agricultural industry must rapidly transition away from traditional, uniform, resource-heavy management practices toward precision, data-driven, highly efficient farming.
Remote sensing in agriculture provides the critical macro-level visibility required to manage complex micro-level field variability. Within this indispensable technological toolkit, the Normalized Difference Vegetation Index (NDVI) remains the bedrock, foundational metric upon which modern precision farming is built. By elegantly translating the complex, invisible biophysical interactions between solar radiation and plant cellular structure into a simple, quantifiable metric of crop health, NDVI empowers modern farmers to act swiftly, optimize their expensive inputs, protect their surrounding natural environment from chemical runoff, and maximize their harvestable yields. Whether you are analyzing decades-old Landsat archives, leveraging free high-res Sentinel-2 data, or deploying the latest state-of-the-art multispectral drones, mastering NDVI is the absolute master key to unlocking the full agronomic and financial potential of your agricultural land in the 21st century.