Satellite Imagery Analysis for Precision Agriculture
Table of Contents
- 1. Satellite Imagery Analysis for Precision Agriculture
- 2. Physics of Remote Sensing and Plant Interactions
- 2.1 Understanding Electromagnetic Radiation and Leaf Optics
- 2.2 Multispectral Sensor Technologies (Sentinel-2, Landsat 8/9)
- 2.3 Hyperspectral Imaging: The Next Frontier in Agronomic Diagnostics
- 3. Vital Vegetation Indices: The Mathematical Engine of Agronomy
- 3.1 Normalized Difference Vegetation Index (NDVI): Strengths and Severe Limitations
- 3.2 Enhanced Vegetation Index (EVI) and Soil Adjusted Vegetation Index (SAVI)
- 3.3 Normalized Difference Red Edge (NDRE) and Precise Chlorophyll Assessment
- 3.4 Advanced Moisture Indices: NDMI and NDWI
- 4. Advanced Preprocessing Pipelines and Atmospheric Correction
- 4.1 Cloud Masking and Shadow Detection
- 4.2 Atmospheric Correction: DOS, FLAASH, and 6S Models
- 5. Artificial Intelligence and Machine Learning Integration
- 5.1 Supervised vs. Unsupervised Machine Learning for Crop Classification
- 5.2 Deep Learning (CNNs and RNNs) for Anomaly Detection
- 6. Commercial Applications of Satellite Data in Precision Agronomy
- 6.1 Variable Rate Technology (VRT) and Dynamic Prescription Maps
- 6.2 Macro-Scale Yield Forecasting and Biomass Estimation
- 6.3 Advanced Irrigation Management and Evapotranspiration (ET) Modeling
- 7. Navigating the Challenges of Satellite Imagery Analysis
- 7.1 The Physics of Resolution Trade-offs
- 7.2 Multi-Modal Data Fusion Architecture
- 7.3 Processing Petabyte-Scale Big Data in the Cloud
- 8. The Future: Synthetic Aperture Radar and Edge Computing
- 8.1 Synthetic Aperture Radar (SAR) for Guaranteed All-Weather Monitoring
- 8.2 Space-Based Edge Computing and Instant Analytics
- 9. Conclusion: The Paradigm Shift in Global Agriculture
- Frequently Asked Questions
rsandgis.me
1. Satellite Imagery Analysis for Precision Agriculture
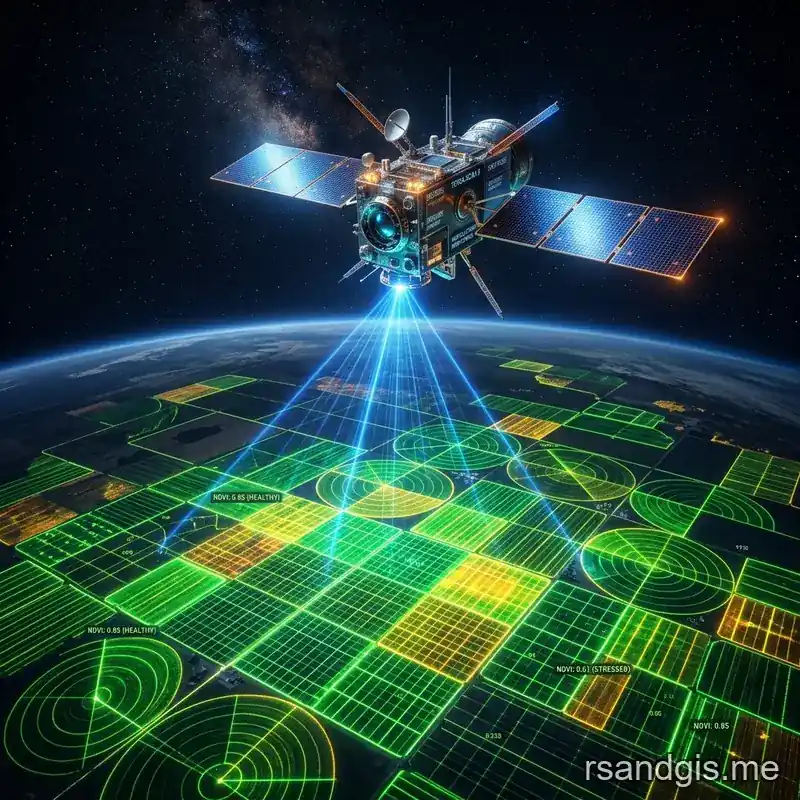
The integration of advanced remote sensing technologies into modern farming practices has fundamentally transformed the global agricultural landscape. At the bleeding edge of this agronomic revolution is satellite imagery analysis for precision agriculture, an incredibly robust discipline that synthesizes aerospace engineering, geospatial data science, plant physiology, and agronomy to mathematically optimize crop yields, aggressively minimize resource waste, and promote long-term sustainable farming. As the global human population steadily climbs toward an estimated 10 billion individuals by the year 2050, the absolute necessity to maximize agricultural output without exhausting finite natural resources, such as arable topsoil and freshwater aquifers, has never been more critical. Satellite-based earth observation provides both the macro-level continental insights and the micro-level sub-field analytics required to achieve these ambitious, high-stakes productivity goals.
Historically, agricultural decision-making relied heavily on sparse ground-level sampling, anecdotal historical data, and farmer intuition. While these traditional methods hold intrinsic value, they critically lack the high spatial and temporal resolution required to manage modern, massive-scale agricultural operations effectively. The advent of the Landsat program in the 1970s marked the dawn of agricultural remote sensing, but it was the launch of high-resolution, high-revisit-rate constellations like the European Space Agency's (ESA) Sentinel-2 and commercial nanosatellite fleets (such as those deployed by Planet Labs and BlackSky) that truly catalyzed the mainstream adoption of satellite imagery analysis for precision agriculture. Today, petabytes of Earth observation data are downlinked daily, processed through intensely complex algorithmic pipelines, and translated into actionable agronomic intelligence that directly drives automated farm machinery.
2. Physics of Remote Sensing and Plant Interactions
To fully grasp the mechanics of satellite imagery analysis for precision agriculture, one must first deeply understand the underlying physics: specifically, the concept of spectral signatures and how electromagnetic radiation interacts with complex biological organisms like crops.
2.1 Understanding Electromagnetic Radiation and Leaf Optics
A plant's spectral signature, its unique, quantifiable pattern of reflectance across the electromagnetic spectrum, is dictated entirely by its current physiological, biochemical, and structural state. When solar radiation strikes a leaf canopy, the photons are either absorbed, transmitted through the leaf tissue, or reflected back into the atmosphere (and subsequently toward the satellite sensor).
Healthy, actively growing vegetation absorbs heavily in the visible light spectrum, specifically in the blue (approx. 450 nm) and red (approx. 650 nm) bands. This absorption is driven by the presence of chlorophyll a and b pigments, which utilize this light energy to power photosynthesis. Conversely, green light (approx. 550 nm) is largely reflected, which is why healthy plants appear green to the human eye. But the most critical region for agricultural remote sensing lies just outside human vision: the near-infrared (NIR) spectrum (approx. 700 to 1300 nm). Healthy mesophyll tissue inside the leaf structure causes incredibly strong scattering and reflectance of NIR energy. When a plant experiences biotic or abiotic stress (e.g., drought, nitrogen deficiency, fungal infection), chlorophyll production halts and cellular structures degrade, causing an immediate, detectable increase in visible red reflectance and a sharp decrease in NIR reflectance. Measuring these minute spectral shifts is the primary scientific objective of multispectral agricultural analysis.
2.2 Multispectral Sensor Technologies (Sentinel-2, Landsat 8/9)
Multispectral sensors capture electromagnetic data in a discrete number of relatively broad spectral bands. The Sentinel-2 mission, equipped with the state-of-the-art MultiSpectral Instrument (MSI), is widely considered the absolute gold standard for public-domain agricultural monitoring. It provides 13 distinct spectral bands, including crucial 'Red Edge' bands that are highly sensitive to subtle changes in chlorophyll content. Sentinel-2 offers spatial resolutions ranging from 10 to 60 meters per pixel, paired with a rapid revisit time of just 5 days at the equator (and more frequently at higher latitudes). Simultaneously, NASA's Landsat 8 and 9 satellites, equipped with the Operational Land Imager (OLI), offer highly calibrated complementary data streams with a 30-meter resolution. The robust data fusion of Sentinel and Landsat data streams allows remote sensing agronomists to build dense, gap-filled time-series datasets, which are crucial for monitoring the highly dynamic phenological stages of crops throughout the entire growing season.
2.3 Hyperspectral Imaging: The Next Frontier in Agronomic Diagnostics
While multispectral sensors analyze a handful of broad bands, hyperspectral sensors capture radiation across hundreds of exceptionally narrow, contiguous spectral bands. This technology creates a continuous, unbroken spectral profile for every single pixel in the image array, allowing for the differentiation of highly specific biochemical traits. With hyperspectral data, analysts can quantify exact nitrogen concentrations in leaf tissue, distinguish between different crop species (e.g., differentiating between soybean and corn canopies early in the season), and even identify individual weed species interspersed within a cash crop. Although hyperspectral imaging has traditionally been restricted to low-altitude aircraft or unmanned aerial vehicles (UAVs), spaceborne hyperspectral missions like Italy's PRISMA and Germany's EnMAP are actively opening massive new frontiers in satellite imagery analysis for precision agriculture, offering unparalleled diagnostic capabilities from low earth orbit.
3. Vital Vegetation Indices: The Mathematical Engine of Agronomy
Raw Top-of-Atmosphere (TOA) reflectance data must be mathematically transformed into vegetation indices (VIs) to isolate the pure plant signal from background noise, such as variable soil reflectance, atmospheric scattering, and changing solar illumination angles. These complex indices serve as the fundamental workhorses of modern satellite imagery analysis for precision agriculture.
3.1 Normalized Difference Vegetation Index (NDVI): Strengths and Severe Limitations
The Normalized Difference Vegetation Index (NDVI) is undeniably the most ubiquitous, heavily utilized index in remote sensing history. It is calculated using the standard normalized ratio formula: NDVI = (NIR - Red) / (NIR + Red). The resulting values mathematically range from -1.0 to +1.0. Values near zero indicate bare soil or water, while values approaching +1.0 indicate dense, vigorously healthy vegetation. While NDVI is excellent for basic, high-level crop scouting and historical benchmarking, it suffers from severe, well-documented limitations in high-yield precision agriculture. Primarily, NDVI tends to 'saturate' at high biomass levels.
For example, in a late-stage corn canopy with a high Leaf Area Index (LAI), NDVI will max out, meaning it can no longer distinguish between varying levels of high health or detect subtle late-season nutrient deficiencies. Also, NDVI is highly sensitive to background soil reflectance during early crop growth stages when the canopy is sparse and soil is clearly visible from orbit.
3.2 Enhanced Vegetation Index (EVI) and Soil Adjusted Vegetation Index (SAVI)
To elegantly overcome the inherent mathematical limitations of NDVI, alternative indices are aggressively employed in advanced satellite imagery analysis for precision agriculture. The Enhanced Vegetation Index (EVI) incorporates the visible blue band to algorithmically correct for atmospheric aerosol scattering and adjusts for canopy background signals, making it vastly more responsive and accurate in high-biomass regions where NDVI saturates. The formula is significantly more complex: EVI = G * ((NIR - Red) / (NIR + C1 * Red - C2 * Blue + L)). For early-season agronomic monitoring, the Soil Adjusted Vegetation Index (SAVI) introduces a crucial soil-brightness correction factor (L), which drastically reduces the analytical noise introduced by bare earth situated between crop rows, allowing for accurate plant counts and early vigor assessments.
3.3 Normalized Difference Red Edge (NDRE) and Precise Chlorophyll Assessment
The 'Red Edge' is a very specific, narrow region of the electromagnetic spectrum (typically around 700-740 nm) where plant reflectance rapidly transitions from extremely low visible red absorption to extremely high NIR reflectance. Advanced sensors like those on Sentinel-2 natively capture this specific transition zone. The Normalized Difference Red Edge (NDRE) index utilizes this critical band: NDRE = (NIR - RedEdge) / (NIR + RedEdge). Because Red Edge light naturally penetrates much deeper into the complex crop canopy than standard visible red light, NDRE does not mathematically saturate as quickly as NDVI. Also, NDRE is highly, directly correlated with actual leaf chlorophyll content, making it the undisputed preferred index for guiding critical late-season nitrogen applications in cereal crops.
3.4 Advanced Moisture Indices: NDMI and NDWI
Water management is a foundational, critical component of precision agriculture, particularly in arid regions reliant on irrigation. The Normalized Difference Moisture Index (NDMI) and Normalized Difference Water Index (NDWI) utilize the Shortwave Infrared (SWIR) bands (typically situated between 1500 and 2500 nm). SWIR energy is highly sensitive to liquid water absorption within the spongy mesophyll of plant leaves. By mathematically comparing SWIR reflectance to NIR reflectance, these advanced indices accurately map localized crop water stress and overall canopy moisture levels. This data is absolutely vital for directly informing automated variable-rate irrigation systems, preventing both yield-destroying drought stress and resource-wasting waterlogging.
4. Advanced Preprocessing Pipelines and Atmospheric Correction
Before any meaningful satellite imagery analysis for precision agriculture can occur, raw satellite imagery (often referred to as Level-1 data) must undergo extremely rigorous preprocessing pipelines to ensure data integrity and scientific validity. Without this, analyzing spectral data is akin to measuring chemical reactions with a fundamentally broken scale.
4.1 Cloud Masking and Shadow Detection
Clouds, cirrus haze, and their projected cloud shadows completely distort the true surface reflectance. Automated, machine-learning-driven cloud masking algorithms, such as the widely used Fmask (Function of mask) or ESA's Sen2Cor, utilize thermal, cirrus, and deep blue bands to accurately identify and permanently mask out obstructed pixels from the dataset. Failure to accurately mask shadows will result in algorithms erroneously categorizing healthy crops as severely stressed or dying vegetation.
4.2 Atmospheric Correction: DOS, FLAASH, and 6S Models
As sunlight travels down through the atmosphere, reflects off the crop canopy, and travels back up to the satellite sensor, the electromagnetic signal is scattered and absorbed by atmospheric gases (like ozone and water vapor) and aerosols (like dust and smoke). Atmospheric correction models are completely mandatory to convert Top-of-Atmosphere (TOA) reflectance to true Bottom-of-Atmosphere (BOA) surface reflectance. Simpler models like Dark Object Subtraction (DOS) are being rapidly replaced by intense, physics-based radiative transfer models like Fast Line-of-sight Atmospheric Analysis of Spectral Hypercubes (FLAASH) or the Second Simulation of the Satellite Signal in the Solar Spectrum (6S). These models ensure that spectral data is radiometrically consistent across long periods of time, allowing an agronomist to accurately compare a satellite image from May 2021 directly with an image from May 2024 without atmospheric bias.
5. Artificial Intelligence and Machine Learning Integration
The true, game-changing power of satellite imagery analysis for precision agriculture is only truly unlocked when traditional radiometric remote sensing techniques are combined with modern computational cloud frameworks and advanced artificial intelligence.
5.1 Supervised vs. Unsupervised Machine Learning for Crop Classification
Accurately mapping and classifying crop types across millions of acres is essential for regional yield forecasting, commodity market trading, and governmental subsidy compliance. Unsupervised classification algorithms, like K-Means or ISODATA clustering, computationally group pixels based strictly on spectral statistical similarity without any prior training data. But supervised machine learning classification yields drastically higher accuracy. By actively providing the algorithm with verified ground-truth 'training data' (e.g., GPS polygons of known corn and soybean fields), advanced machine learning classifiers such as Random Forest (RF), Support Vector Machines (SVM), and Gradient Boosting algorithms (like XGBoost) can mathematically learn the highly complex, multi-temporal spectral signatures of specific crop types. Time-series analysis, tracking precisely how a pixel's spectral reflectance dynamically changes from planting to harvest, is crucial here, as different crops exhibit highly distinct phenological growth curves.
5.2 Deep Learning (CNNs and RNNs) for Anomaly Detection
Deep learning, particularly Convolutional Neural Networks (CNNs), is rapidly advancing the field of satellite imagery analysis for precision agriculture. Unlike traditional pixel-based classifiers that only look at one pixel at a time, CNNs analyze the spatial context, the intricate geometric relationships and textures between adjacent pixels. This allows them to identify highly complex, macroscopic patterns indicative of specific agricultural problems.
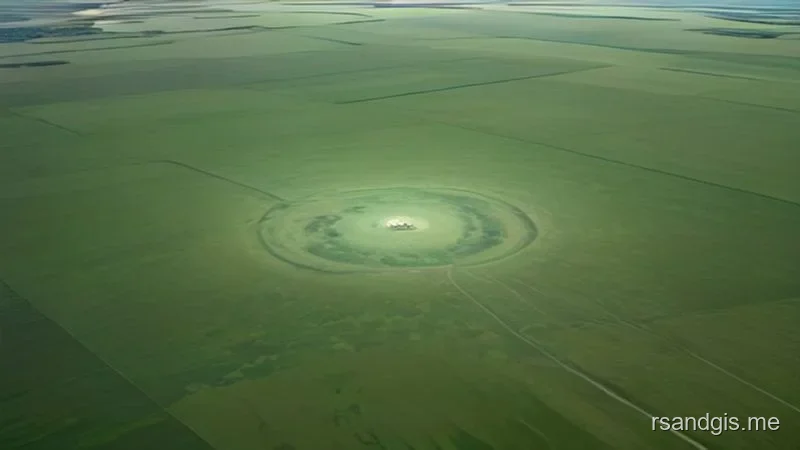
For instance, a properly trained CNN can recognize the distinct circular spreading pattern of a center-pivot irrigation failure or the localized, expanding geometry of a fungal outbreak. Also, Recurrent Neural Networks (RNNs) and Long Short-Term Memory (LSTM) networks are uniquely suited for analyzing sequential time-series satellite data, predicting future crop stress events weeks before visible symptoms manifest in the canopy.
6. Commercial Applications of Satellite Data in Precision Agronomy
The intense analytical and mathematical pipelines described above ultimately feed into highly practical, field-level commercial agronomic applications designed specifically to maximize a farm's Return on Investment (ROI) and environmental stewardship.
6.1 Variable Rate Technology (VRT) and Dynamic Prescription Maps
Perhaps the most direct, financially impactful commercial application of satellite imagery analysis for precision agriculture is the creation of highly precise management zones for Variable Rate Technology (VRT). Fields are fundamentally never uniform; subtle variations in soil composition, localized topography, and historical management practices create massive spatial variability in overall yield potential. By running complex clustering algorithms on multi-year, gap-filled satellite VIs, agronomists can clearly delineate these stable management zones. Instead of applying a traditional, wasteful flat rate of nitrogen fertilizer across an entire 500-acre field, digital prescription maps dictate precise, georeferenced application rates based on the specific yield potential of each zone. High-potential zones receive slightly more inputs to absolutely maximize yield, while low-potential or environmentally sensitive zones receive less, drastically reducing chemical costs and actively minimizing nitrogen runoff into local waterways and aquifers.
6.2 Macro-Scale Yield Forecasting and Biomass Estimation
Accurate, real-time pre-harvest yield forecasting is incredibly critical for global food security logistics, international commodity trading, and farm-level storage and logistics planning. By intricately integrating empirical satellite data (e.g., measuring peak-season Leaf Area Index derived from the EVI index) with robust mechanistic crop simulation models (like DSSAT or APSIM) and hyper-local meteorological data, quantitative analysts can predict end-of-season crop yields with remarkable accuracy at both the macro (national) and micro (sub-field) levels. These predictive models rely absolutely on the continuous, unbroken monitoring capabilities provided by satellite imagery analysis for precision agriculture to aggressively adjust forecasts dynamically as the growing season progresses and weather events unfold.
6.3 Advanced Irrigation Management and Evapotranspiration (ET) Modeling
Freshwater scarcity is an aggressively escalating global crisis, and agriculture is the primary consumer of freshwater globally. Satellite-derived thermal infrared imagery (captured by specialized sensors like Landsat 8's Thermal Infrared Sensor (TIRS) or the ISS-mounted ECOSTRESS instrument) is utilized to calculate land surface temperature with high precision. When this thermal data is combined with localized meteorological data (wind speed, humidity, solar radiation), thermodynamic algorithms like the Surface Energy Balance Algorithm for Land (SEBAL) or METRIC calculate actual Evapotranspiration (ETa). This definitively maps exactly how much water is actively being consumed by the crop canopy versus lost to soil evaporation. This empowers farmers to engage in true precision irrigation, replacing only the precise volume of water that has been depleted, radically optimizing center pivot irrigation schedules, saving millions of gallons of water, and preventing both yield-destroying drought stress and root-suffocating waterlogging.
7. Navigating the Challenges of Satellite Imagery Analysis
Despite its immense, proven potential, the widespread implementation of satellite imagery analysis for precision agriculture is not without very significant technical and logistical hurdles that data scientists must navigate.
7.1 The Physics of Resolution Trade-offs
Spacecraft sensor design is strictly governed by the immutable laws of physics and the constraints of orbital mechanics, resulting in an inherent, unavoidable trade-off between spatial resolution (the physical size of a pixel on the ground), temporal resolution (how often the satellite flies over the same exact spot), and spectral resolution (the specific number of light bands captured). A sensor simply cannot simultaneously capture 1-meter hyperspectral data of the entire planet every single day. As a result, agronomists must strategically select the appropriate data source for their highly specific use case. While the free 10-meter Sentinel-2 data is excellent for broad, field-level nutrient management, detecting early-stage insect damage in densely planted row crops may absolutely necessitate the costly commercial tasking of high-resolution, sub-meter satellite constellations.
7.2 Multi-Modal Data Fusion Architecture
To fundamentally overcome the physical limitations of singular satellite systems, the AgTech industry is moving heavily toward complex multi-modal data fusion. Satellite imagery analysis for precision agriculture is exponentially more potent when deeply contextualized by other disparate data streams. Satellites provide the necessary macro-level, high-frequency temporal view. Unmanned Aerial Vehicles (UAVs or drones) provide ultra-high spatial resolution imagery on-demand, safely beneath the atmospheric cloud cover. In-field Internet of Things (IoT) sensors (e.g., deep soil moisture probes, micro-weather stations, sap flow sensors) provide the absolute, indisputable ground truth. The massive computational challenge lies in developing the advanced geospatial software architectures capable of assimilating, precisely geo-registering, and co-analyzing these wildly disparate datasets in real-time without crashing systems.
7.3 Processing Petabyte-Scale Big Data in the Cloud
A single, uncompressed multispectral satellite image covering a county can easily exceed several gigabytes in size. Analyzing continuous time-series data across millions of acres for regional studies generates literal petabytes of unstructured data. Traditional, on-premise desktop GIS software is completely, hopelessly ill-equipped to handle this staggering volume. The meteoric rise of cloud-based geospatial processing platforms, most notably Google Earth Engine (GEE), the Amazon Web Services (AWS) Open Data Registry, and the Microsoft Planetary Computer, has fully democratized satellite imagery analysis for precision agriculture. These cutting-edge platforms natively co-locate the massive, historical satellite archives directly alongside massive arrays of parallel computing power. This revolutionary architecture allows geospatial data scientists to run wildly complex machine learning algorithms over entire continental scales in mere seconds utilizing highly optimized Python, R, or JavaScript APIs.
8. The Future: Synthetic Aperture Radar and Edge Computing
The technological horizon for remote sensing in agriculture is expanding at a breakneck pace, promising to elegantly elegantly solve many of today's existing operational limitations.
8.1 Synthetic Aperture Radar (SAR) for Guaranteed All-Weather Monitoring
The absolute greatest adversary of optical satellite imagery is tropospheric cloud cover. In equatorial zones and temperate agricultural regions during the critical spring growing season, many weeks can pass without a single clear optical image. Synthetic Aperture Radar (SAR), utilized heavily by satellite constellations like ESA's Sentinel-1, actively beams focused microwave pulses down to the Earth's surface and measures the backscattered energy. Because these long-wavelength microwaves penetrate clouds, heavy rain, and weather systems completely smoothly, SAR provides a guaranteed, continuous observation capability, day or night. In specific agricultural contexts, SAR backscatter is highly physically sensitive to volumetric soil moisture, crop structural geometry (e.g., stalk orientation, biomass density), and surface roughness. The complex, non-linear algorithmic fusion of optical data with SAR data is currently the single most active, heavily funded, and promising research frontier in the entire field of satellite imagery analysis for precision agriculture.
8.2 Space-Based Edge Computing and Instant Analytics
Currently, raw satellite data must be physically downlinked to massive ground stations, transferred to cloud servers, processed through pipelines, and then distributed to the end-user, a multi-step process that introduces critical hours or days of latency. The imminent future of the industry lies in space-based edge computing. Next-generation satellites are actively being equipped with highly advanced, radiation-hardened onboard AI processing units (such as modified GPUs) capable of running the complex image analysis directly in orbit. Instead of beaming down gigabytes of useless raw pixels, the smart satellite will execute the neural network in space and downlink only a few kilobytes of actionable insights, such as a mathematically ready-to-use variable-rate nitrogen prescription map or an instant, localized alert regarding a broken center-pivot irrigation system, transmitting it directly to the farmer's smart tractor cab or mobile device in absolute near real-time.
9. Conclusion: The Paradigm Shift in Global Agriculture
The global transition from traditional, intuition-based farming to rigorous, data-driven digital agronomy is no longer a futuristic, conceptual idea; it is an immediate economic and ecological imperative. Satellite imagery analysis for precision agriculture sits permanently at the very core of this major shift, offering an entirely unparalleled, highly scalable vantage point from which to mathematically monitor, accurately model, and profitably manage crop health at a planetary scale. By aggressively leveraging the full, unadulterated spectrum of electromagnetic data, from standard NDVI and highly advanced Red Edge metrics to thermal evapotranspiration models and all-weather microwave SAR backscatter, modern agronomists can diagnose crop stress with surgical, pinpoint accuracy.
As deep machine learning algorithms become exponentially more sophisticated and globally distributed cloud computing architectures become ubiquitous and more financially accessible, the historical barrier to entry for utilizing these insanely complex geospatial datasets will continue to collapse. The ultimate, overarching goal is not merely to amass a vast lake of raw data, but to algorithmically distill the petabytes of orbiting intelligence into simple, profitable, and highly sustainable execution decisions on the physical ground. For the modern, competitive agricultural enterprise, thoroughly mastering satellite imagery analysis for precision agriculture is not merely an optional technological upgrade; it is the fundamental, non-negotiable prerequisite for ensuring highly resilient, economically optimized, and ecologically sound crop production in the 21st century and indefinitely beyond.
Frequently Asked Questions
What is precision agriculture in remote sensing?
Precision agriculture uses satellite imagery, GPS, and GIS to observe, measure, and respond to variability in crops. Instead of applying water and fertilizer evenly across a whole field, farmers apply resources only exactly where they are needed.
What role does NDVI play in agriculture?
The Normalized Difference Vegetation Index (NDVI) is a standard mathematical formula applied to multispectral satellite data (measuring Red and Near-Infrared light) to quantify plant health, vigor, and photosynthetic capacity across a field.
How frequently do satellites capture agricultural data?
Public constellations like Sentinel-2 revisit the same field every 5 days, while commercial constellations like PlanetScope (Planet Labs) capture high-resolution imagery daily, providing farmers with near real-time insights into rapid crop changes.
