Change Detection in Remote Sensing
Table of Contents
- Introduction to Change Detection in Remote Sensing
- What is Change Detection?
- The Critical Importance and Global Applications
- Fundamentals of Remote Sensing for Change Detection
- The Four Pillars of Resolution
- Crucial Pre-processing Steps
- Geometric Correction and Image Registration
- Radiometric and Atmospheric Correction
- Traditional Change Detection Techniques
- Image Differencing
- Image Ratioing
- Principal Component Analysis (PCA)
- Change Vector Analysis (CVA)
- Advanced and Classification-Based Methods
- Post-Classification Comparison (PCC)
- Unsupervised Change Detection
- The Machine Learning and Deep Learning Revolution
- Object-Based Image Analysis (OBIA)
- Deep Learning and Convolutional Neural Networks (CNNs)
- Essential Spectral Indices for Change Monitoring
- NDVI (Normalized Difference Vegetation Index)
- NDWI and NDBI
- Critical Challenges in the Field
- Cloud Cover and Shadows
- Phenological Variations
- Data Harmonization Across Sensors
- Future Trends in Change Detection
- Conclusion
- Frequently Asked Questions
rsandgis.me
Introduction to Change Detection in Remote Sensing
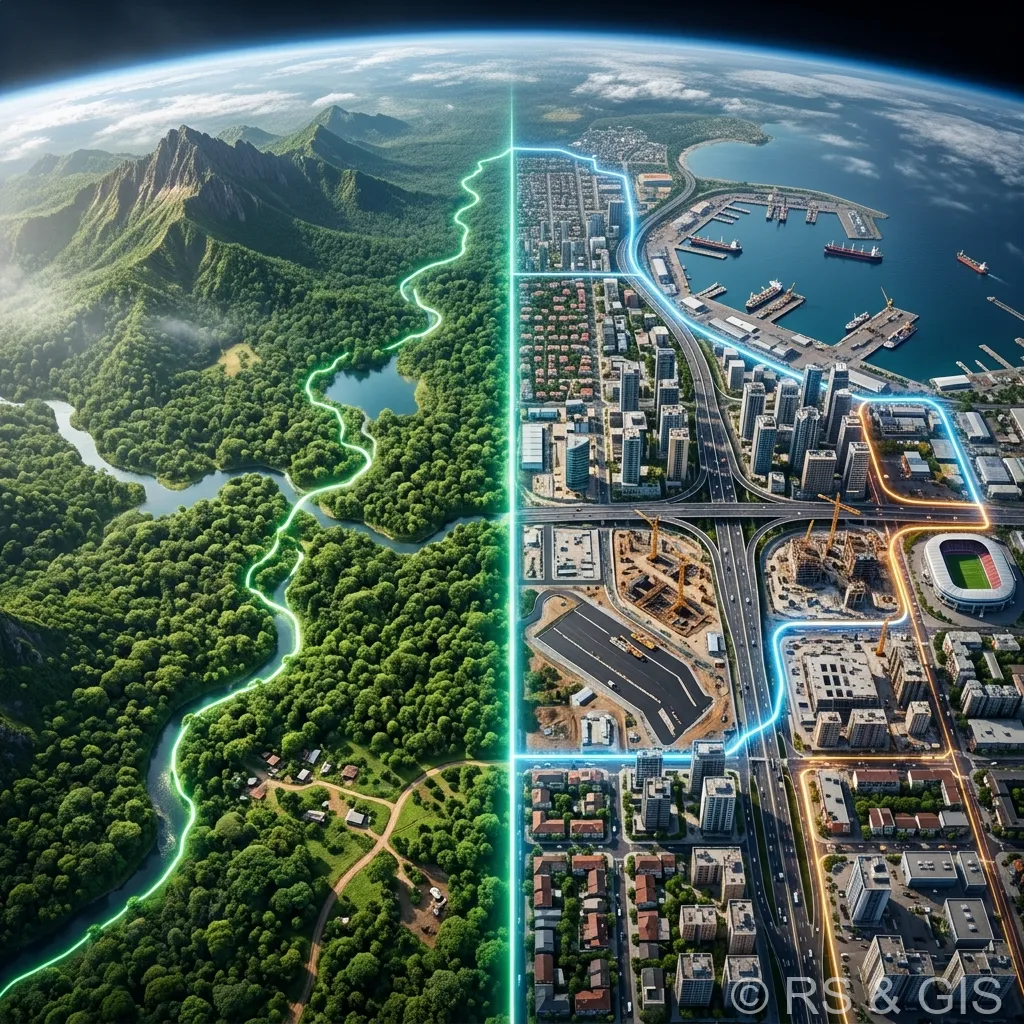
In an era defined by rapid environmental transformation, climatic shifts, and relentless urban expansion, monitoring the Earth's surface has never been more critical. Change detection in remote sensing is the sophisticated analytical process of identifying, quantifying, and evaluating spatial and temporal differences in the state of land features or physical phenomena. By leveraging multi-temporal satellite imagery, aerial photography, and advanced sensor data, geospatial analysts and environmental scientists can pinpoint precise modifications in land cover and land use over days, months, or even decades.
What is Change Detection?
Fundamentally, change detection measures how the biological, physical, or chemical attributes of a specific geographical area have altered between two or more time periods (T1 and T2). As a fundamental application of Geographic Information Systems (GIS) and remote sensing technologies, the process involves co-registering multiple images of the same location and employing mathematical, statistical, or machine learning algorithms to isolate true environmental changes from background noise, sensor anomalies, or atmospheric interference.
The Critical Importance and Global Applications
The applications of change detection are vast and interdisciplinary, providing actionable intelligence across numerous sectors. Key applications include:
- Urban Planning and Sprawl Monitoring: Tracking the expansion of impervious surfaces, monitoring infrastructural development, and managing sustainable smart cities.
- Deforestation and Forestry Management: Quantifying logging activities, forest degradation, and illegal clear-cutting in the Amazon and other vital biomes.
- Disaster Management and Damage Assessment: Evaluating the immediate and long-term impacts of natural disasters such as wildfires, floods, hurricanes, and earthquakes to facilitate rapid emergency response.
- Agricultural Monitoring: Assessing crop health phenology, identifying irrigation changes, and predicting yield variations driven by climate change.
- Glacial Retreat and Climate Change: Measuring the shrinking of polar ice caps and high-altitude glaciers as primary indicators of global warming.
Fundamentals of Remote Sensing for Change Detection
To perform accurate change detection, one must deeply understand the fundamental properties of remote sensing data. The success of any change detection project hinges entirely on the quality, compatibility, and resolution of the source imagery.
The Four Pillars of Resolution
Remote sensing imagery is defined by four primary resolution metrics, all of which dictate the feasibility of a change detection workflow:
- Spatial Resolution: Refers to the size of the smallest discernible feature on the ground (e.g., Landsat at 30m vs. WorldView at 0.3m). High spatial resolution is essential for detecting micro-changes like building construction, while medium resolution suffices for regional forest monitoring.
- Spectral Resolution: The number and width of spectral bands the sensor records. Sensors with high spectral resolution (hyperspectral) can differentiate subtle chemical or biological changes in vegetation that multispectral sensors might miss.
- Temporal Resolution: The revisit time of the satellite over the exact same location. High temporal resolution (e.g., MODIS revisiting daily) is crucial for monitoring rapid phenomena like floods or crop phenology.
- Radiometric Resolution: The sensor's sensitivity to the magnitude of electromagnetic energy, defining its ability to distinguish slight differences in energy (e.g., 8-bit vs. 12-bit data).
Crucial Pre-processing Steps
Raw satellite data is inherently flawed. Before any comparative algorithm can be applied, rigorous pre-processing is mandatory to ensure that the detected changes reflect actual ground modifications rather than systemic errors. The goal is to make the multi-temporal images as radiometrically and geometrically identical as possible.
Geometric Correction and Image Registration
Geometric correction eliminates distortions caused by the Earth's rotation, sensor angle, and topographic relief. For change detection, co-registration is paramount. Images from T1 and T2 must be aligned precisely to a fraction of a pixel (typically < 0.5 RMSE). If images are misaligned, false changes, often referred to as "slivers" or registration noise, will completely invalidate the analysis.
Radiometric and Atmospheric Correction
Because images are acquired on different dates, they are subject to varying atmospheric conditions (haze, aerosols, water vapor), solar elevation angles, and Earth-sun distances. Radiometric correction converts raw digital numbers (DN) into physically meaningful units like Top-of-Atmosphere (TOA) reflectance or Surface Reflectance (SR). Advanced models like FLAASH (Fast Line-of-sight Atmospheric Analysis of Hypercubes) or DOS (Dark Object Subtraction) are deployed to strip away atmospheric scattering, ensuring that the spectral signatures being compared are genuinely reflective of ground conditions.
Traditional Change Detection Techniques
Over the decades, a variety of algorithms have been developed to extract change information. While traditional, these pixel-based methods remain highly effective, computationally efficient, and widely used in the remote sensing industry.
Image Differencing
Image differencing is the most ubiquitous and straightforward algorithm. It involves subtracting the pixel values of the T1 image from the exact corresponding pixels in the T2 image. Mathematically, it is expressed as:
Δx = x(T2) - x(T1)
Pixels representing areas of no change cluster around zero, while areas of significant change fall in the tails of the Gaussian distribution. Analysts apply statistically derived thresholds (e.g., +/- 1 standard deviation) to isolate the changed pixels. While highly efficient, its primary limitation is that it only indicates the magnitude of change, not the nature (from-to classification) of the change.
Image Ratioing
Similar to differencing, image ratioing divides the pixel values of the newer image by the older image (T2 / T1). Pixels with a value of 1 indicate no change. Ratioing is particularly adept at mitigating the effects of topography and shadow, as these multiplicative factors tend to cancel out during the division process.
Principal Component Analysis (PCA)
Principal Component Analysis is a sophisticated statistical dimensionality reduction technique. When applied to multi-temporal datasets, PCA transforms the highly correlated multispectral bands into a new set of uncorrelated variables called principal components (PCs). In a stacked T1-T2 dataset, the first few PCs typically capture the variance associated with stable land cover (background data), while the minor components (e.g., PC3, PC4) isolate the variance resulting from actual land cover changes. PCA is excellent for filtering out noise and enhancing the change signal.
Change Vector Analysis (CVA)
Change Vector Analysis operates in a multi-dimensional spectral space. Instead of comparing single bands or indices, CVA analyzes both the magnitude and direction of change across multiple spectral dimensions simultaneously. By plotting the spectral position of a pixel at T1 and T2, CVA calculates a vector. The length of the vector indicates the intensity of the change, while the angle (direction) hints at the type of change (e.g., clearing of vegetation vs. flooding). CVA is incredibly robust but requires rigorous atmospheric normalization to succeed.
Advanced and Classification-Based Methods
When analysts need to know exactly what an area changed from and what it changed into, they turn to classification-based approaches. These methods convert continuous spectral data into discrete thematic maps before or during the change detection process.
Post-Classification Comparison (PCC)
PCC is arguably the most intuitive method. The analyst performs an independent classification on the T1 image (e.g., using Random Forest or Maximum Likelihood to map water, forest, urban, and agriculture) and repeats the exact process for the T2 image. The two resulting thematic maps are then overlaid to generate a change matrix.
| From / To | Forest (T2) | Urban (T2) | Water (T2) |
|---|---|---|---|
| Forest (T1) | No Change | Deforestation/Urbanization | Flooding |
| Urban (T1) | Afforestation | No Change | Inundation |
The primary advantage of PCC is its detailed "from-to" trajectory output. But its major flaw is that errors in the individual classifications multiply. If T1 is 85% accurate and T2 is 85% accurate, the resulting change map might only be around 72% accurate (0.85 * 0.85).
Unsupervised Change Detection
Unsupervised methods do not require ground-truth training data. Techniques like ISODATA or K-means clustering group the multi-temporal difference image into natural spectral clusters. The analyst then interprets these clusters post-generation to determine which represent change and which represent stable ground. This is highly useful in remote or inaccessible regions where field data is nonexistent.
The Machine Learning and Deep Learning Revolution
The paradigm of change detection is currently undergoing a massive shift thanks to Artificial Intelligence (AI). Traditional pixel-based methods often struggle with high-resolution imagery (like drone or 0.3m satellite data) because the high detail introduces massive internal variability (e.g., seeing individual tree branches rather than a homogeneous forest canopy).
Object-Based Image Analysis (OBIA)
To combat the salt-and-pepper noise inherent in high-resolution pixel analysis, OBIA segments the image into meaningful "objects" or polygons (e.g., a whole building roof, a contiguous agricultural field) based on shape, texture, and spectral characteristics. Change detection is then performed on these objects rather than individual pixels. This mirrors human cognitive interpretation and vastly improves accuracy in urban environments.
Deep Learning and Convolutional Neural Networks (CNNs)
Deep learning models, particularly Convolutional Neural Networks (CNNs) like U-Net or Siamese Networks, have set new benchmarks in change detection accuracy. Siamese Networks take the T1 and T2 images through twin neural architectures sharing the same weights. By extracting deep spatial-contextual features, rather than relying solely on spectral signatures, these models can distinguish complex semantic changes (e.g., a new road being paved) while ignoring superficial differences like seasonal snow cover or different shadowing angles. Also, Recurrent Neural Networks (RNNs) and Vision Transformers (ViTs) are increasingly used to analyze dense temporal stacks (time-series data) to monitor gradual ecological trends.
Essential Spectral Indices for Change Monitoring
Transforming raw spectral bands into specialized indices before differencing is a proven strategy to highlight specific environmental variables while suppressing topographic and illumination artifacts.
NDVI (Normalized Difference Vegetation Index)
The NDVI is the gold standard for vegetation monitoring. By leveraging the fact that healthy vegetation strongly absorbs Red light and strongly reflects Near-Infrared (NIR) light, NDVI is calculated as: (NIR - Red) / (NIR + Red). Subtracting a T1 NDVI map from a T2 NDVI map instantly highlights areas of vegetation loss (deforestation, fires) or gain (agricultural growth, reforestation).
NDWI and NDBI
Similarly, the Normalized Difference Water Index (NDWI) utilizes Green and NIR bands to isolate open water bodies, making it the premier choice for monitoring flood dynamics, reservoir depletion, and coastal erosion. Conversely, the Normalized Difference Built-up Index (NDBI) uses Shortwave Infrared (SWIR) and NIR to highlight impervious surfaces, serving as a critical tool for mapping urban sprawl over time.
Critical Challenges in the Field
Despite algorithmic advancements, remote sensing analysts constantly battle physical and environmental limitations that complicate change detection.
Cloud Cover and Shadows
Optical sensors cannot penetrate clouds. In tropical regions (e.g., the Amazon or Southeast Asia), finding a cloud-free image is exceedingly rare. Cloud shadows also mimic land cover changes, causing massive false positives. To circumvent this, analysts increasingly rely on Synthetic Aperture Radar (SAR) platforms, like Sentinel-1. SAR uses active microwave pulses that penetrate clouds, operating effectively day or night, making it indispensable for continuous monitoring in cloudy regions.
Phenological Variations
Seasonal changes in vegetation (phenology) can mimic permanent land cover changes.
For example, comparing a summer image to a winter image will show a massive loss of vegetation, but this is merely seasonal leaf-drop, not deforestation. Utilizing "anniversary dates" (images acquired in the same month of different years) or utilizing dense time-series harmonic analysis (like the BFAST algorithm) are necessary to separate seasonal cycles from true permanent disruptions.
Data Harmonization Across Sensors
Long-term studies (spanning 40+ years) require chaining together data from different satellite generations (e.g., Landsat 5, 7, 8, and 9). Because sensor bandpass widths and radiometric sensitivities differ, analysts must mathematically harmonize the data sets to ensure that a change in sensor does not falsely register as a change on the ground.
Future Trends in Change Detection
The future of change detection lies in the fusion of multi-sensor data and real-time processing. We are moving away from isolated, bi-temporal analysis toward continuous monitoring paradigms. Platforms like Google Earth Engine (GEE) and Microsoft Planetary Computer allow researchers to process petabytes of time-series data in the cloud without downloading a single file.
Also, the integration of SAR and Optical data fusion is becoming standard practice. By combining the textural/structural insights of radar with the multispectral intelligence of optical sensors, machine learning models can achieve near-perfect classification accuracies. Also, the rise of commercial micro-satellite constellations (like Planet Labs) providing daily, high-resolution global coverage means that "change detection" is transforming into "change alerting", enabling automated, daily pings whenever an illegal logging road is cut or a new building foundation is poured.
Conclusion
Change detection in remote sensing remains an indispensable capability for understanding human impact on the planet and managing natural resources efficiently. From foundational techniques like image differencing to cutting-edge deep learning architectures analyzing SAR-optical fused datasets, the methodologies continue to evolve rapidly. As satellite data becomes more ubiquitous, open, and granular, our ability to monitor, quantify, and ultimately protect the Earth's dynamic systems will reach unparalleled levels of precision. Mastery of these spatial, spectral, and algorithmic principles is essential for any modern geospatial professional tasked with deciphering the story of our changing world.
Frequently Asked Questions
What is change detection in remote sensing?
Change detection is the process of identifying differences in the state of an object or phenomenon by observing it at different times. In remote sensing, this involves analyzing satellite imagery from two or more dates to map urban growth, deforestation, or disaster impacts.
Which algorithms are used for change detection?
Common algorithms include Image Differencing, Principal Component Analysis (PCA), Change Vector Analysis (CVA), and increasingly, deep learning methods like Siamese Convolutional Neural Networks for automated, high-precision detection.
What challenges exist in remote sensing change detection?
The biggest challenges are separating real landscape changes from 'false' changes caused by different atmospheric conditions, sun angles, sensor calibration differences, and seasonal vegetation changes.
