Time Series Analysis Of Satellite Imagery GEE
Table of Contents
- Understanding Google Earth Engine for Remote Sensing
- The Architecture of GEE
- Why Choose GEE for Time Series?
- Data Preparation and Preprocessing
- Selecting the Right Image Collection
- Cloud Masking and Quality Assessment
- Harmonizing Multi-Sensor Data
- Techniques for Time Series Analysis
- Image Reduction and Compositing
- Vegetation Indices and Spectral Transformations
- Anomaly Detection and Z-Scores
- Advanced Methodologies in Time Series Analysis
- Harmonic Modeling and Fourier Transforms
- The LandTrendr Algorithm
- BFAST (Breaks For Additive Season and Trend)
- Continuous Change Detection and Classification (CCDC)
- Specific Use Cases for Temporal Analysis
- Agricultural Monitoring and Precision Farming
- Water Resource Management
- Urbanization and Land Cover Change
- Implementing Time Series Analysis in GEE
- Setting Up Your Workspace
- Building a Time Series Chart
- Exporting Time Series Data
- Challenges and Best Practices
- Handling Large Datasets and Memory Limits
- Addressing Data Gaps and Noise
- Validating Results
- The Future of Earth Observation and Time Series
- Integration with Deep Machine Learning
- Real-Time Monitoring and Alert Systems
- Conclusion
- Frequently Asked Questions
rsandgis.me
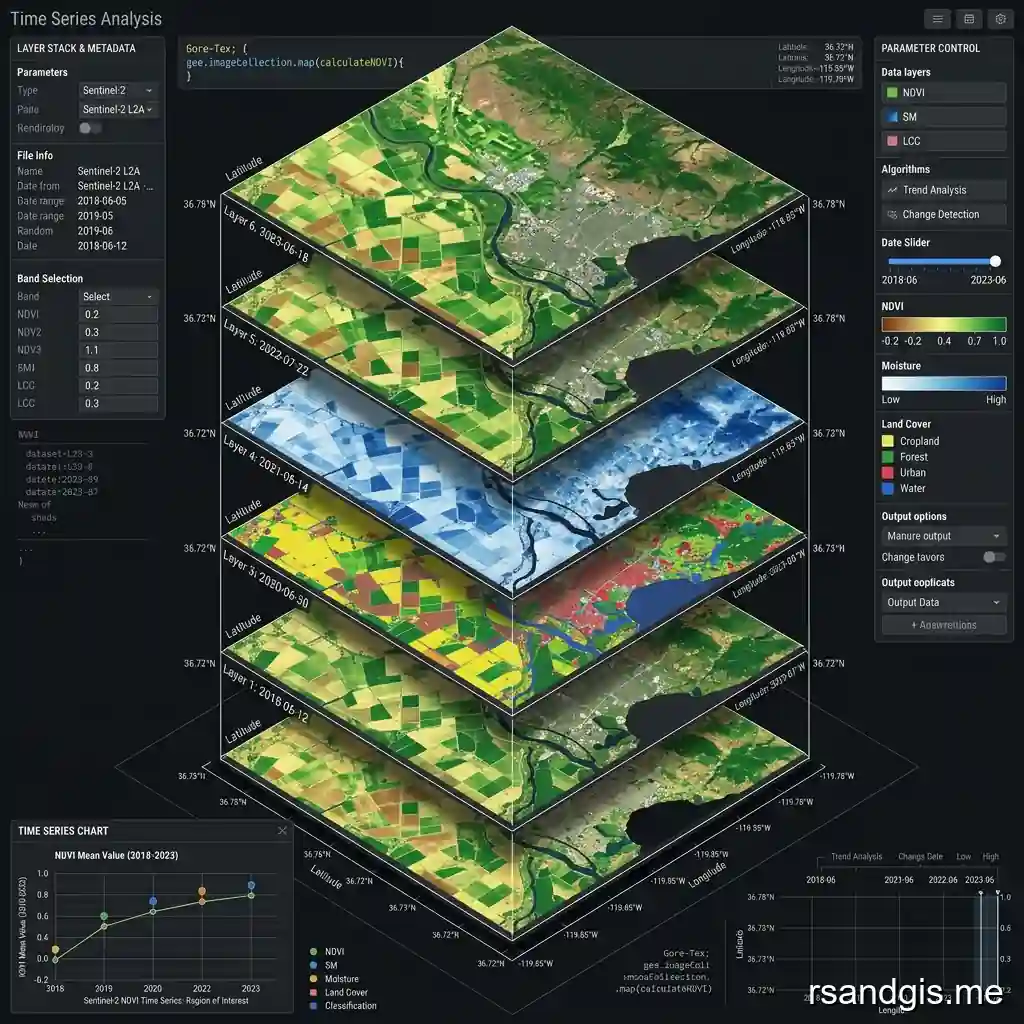
In the rapidly evolving field of remote sensing, the ability to perform a robust time series analysis of satellite imagery gee is a major advancement for researchers, environmental scientists, and geographers alike. Google Earth Engine (GEE) has completely revolutionized the way we access, process, and interpret planetary-scale geographic data. By providing access to petabytes of satellite imagery and geospatial datasets, GEE allows users to conduct complex analyses without the need to download large files to a local machine. This article will explore the comprehensive techniques and methodologies required to master temporal spatial data evaluation, providing you with a complete roadmap for tracking environmental changes, monitoring agricultural health, observing urban development, and mapping ecological disasters over extended periods.
Before the advent of cloud-based spatial computing, researchers were bound by the severe limitations of their local hardware. Downloading hundreds of scenes, conducting radiometric calibration, and calculating indices locally required massive storage capacities and immense computational power. Today, Earth Engine shifts this paradigm entirely. Processing happens directly on Google's servers, allowing users to aggregate decades of Earth observation data in mere seconds. This guide is tailored to help both novices and seasoned professionals leverage this immense power to unlock the secrets hidden within temporal satellite data, ensuring that your projects are both scientifically rigorous and computationally efficient.
Understanding Google Earth Engine for Remote Sensing
Google Earth Engine is a powerful, cloud-based platform designed specifically for planetary-scale environmental data analysis. It intuitively combines a multi-petabyte catalog of satellite imagery and geospatial datasets with unparalleled planetary-scale analysis capabilities. Scientists, researchers, and developers use Earth Engine to detect subtle changes, map long-term trends, and quantify spatial differences on the Earth's surface across vast geographic extents and immense temporal depths. Unlike conventional desktop GIS software, GEE brings the algorithm directly to the data rather than bringing the data to the algorithm, fundamentally transforming traditional remote sensing workflows.
The Architecture of GEE
Fundamentally, Google Earth Engine is built on top of the highly robust Google Cloud infrastructure. It utilizes massive parallel processing to handle intensive computations that would otherwise take months or even years on a standard desktop computer. The architecture is broadly divided into two main components: the massive data catalog, which hosts the raw, pre-processed, and derived imagery from a multitude of providers, and the distributed compute engine, which processes the complex algorithms requested by the user through the Application Programming Interface (API). The API is readily available in both JavaScript (via a highly accessible web-based IDE) and Python (via libraries suitable for Jupyter notebooks), making it universally accessible to a broad audience of web developers, ecologists, and spatial data scientists. This bifurcated yet cohesive structure ensures that users can easily prototype algorithms interactively in the browser and then smoothly scale them into automated production environments.
Why Choose GEE for Time Series?
When it comes to tracking phenomenological changes over time, traditional geographic information systems (GIS) often fall drastically short due to strict storage limitations and processing bottlenecks. Handling a dense stack of hundreds of high-resolution images for a single small county is daunting; scaling that operation to a national or continental level is practically impossible without a dedicated server cluster. Google Earth Engine excels in this exact domain by allowing users to instantly access decades of historical data from flagship satellite missions such as Landsat, Sentinel, and MODIS. The ability to mathematically filter, mask, map custom functions, and analyze thousands of images in a matter of seconds makes GEE the undisputed global leader for large-scale temporal studies. Plus, the platform's ability to easily apply these algorithms across a time stack, technically represented as an `ImageCollection`, greatly simplifies the extraction of meaningful temporal profiles. You can compress years of raw, unstructured data into single, synthesized insights with just a few lines of elegant code.
Data Preparation and Preprocessing
Before diving into complex mathematical models and predictive algorithms, it is absolutely crucial to meticulously prepare your data. The final accuracy of any temporal study heavily relies on the pristine quality of the input data stream. Preprocessing steps are strictly essential to ensure that the final analysis reflects genuine phenomenological changes on the ground rather than artificial anomalies caused by atmospheric conditions, sensor errors, orbital shifts, or localized severe weather events.
Selecting the Right Image Collection
The foundational step in any time series project is choosing the appropriate satellite data collection. The legacy Landsat program (jointly managed by NASA and the USGS) provides the longest continuous space-based record of Earth's land in existence, making it absolutely ideal for long-term historical studies extending back to the 1980s. But its 30-meter spatial resolution and 16-day revisit cycle might not be sufficient for all modern use cases. On the other hand, the Sentinel-2 mission, operated by the European Space Agency (ESA) under the Copernicus program, offers a much higher spatial resolution (up to 10 meters) and a more frequent revisit time (approximately 5 days). This makes Sentinel-2 perfectly suited for short-term, high-detail temporal monitoring such as precision agriculture and rapid disaster response. For studies prioritizing temporal density over spatial granularity, the Moderate Resolution Imaging Spectroradiometer (MODIS) is excellent, offering near-daily global coverage that is invaluable for capturing rapid phonological changes or tracking wide-scale climate variables.
Cloud Masking and Quality Assessment
Thick clouds, transient cloud shadows, and dense atmospheric haze are the biggest adversaries of optical remote sensing. In a long-term time series, a single heavily clouded pixel can drastically skew the statistical results of your analysis, generating false positives in change detection algorithms and ruining temporal curves. Fortunately, Google Earth Engine provides built-in Quality Assessment (QA) bands for most of its optical datasets. Using these specialized QA bands, analysts can write dedicated functions to mask out pixels obstructed by clouds, shadows, cirrus formations, or heavy snow cover. A highly common methodology involves applying a strict bitwise extraction on the QA band to uniquely identify and remove poor-quality pixels before they are passed into the main analytical workflow. By mapping these masking functions over an entire `ImageCollection`, users ensure that only pure, clear-sky observations contribute to the final statistical analysis.
Harmonizing Multi-Sensor Data
For extensive studies that span multiple decades, researchers frequently need to mathematically combine data from different sensors, such as Landsat 5, 7, 8, and the newer Landsat 9. Because these specific sensors have different spectral response functions, varying bandwidths, and unique orbital characteristics, the data must be mathematically harmonized. Techniques such as the application of ordinary least squares (OLS) regression coefficients or Reduced Major Axis (RMA) regressions can accurately adjust the reflectance values of one sensor to closely match those of another. This vital cross-calibration ensures a continuous, highly stable baseline, allowing for accurate trend detection over 30 or 40 years without artificial data jumps or systemic biases caused simply by sensor transitions and hardware upgrades.
Techniques for Time Series Analysis
Once the data is robustly preprocessed, harmonized, and cleaned of visual anomalies, various mathematical techniques can be applied to extract valuable insights. The choice of technique heavily depends on the specific, predefined goals of the research, whether it is to observe seasonal phenology, detect sudden catastrophic events like deforestation or urban flooding, or continuously monitor slow, gradual environmental processes like regional desertification.
Image Reduction and Compositing
Working with an entire stack of images simultaneously can be incredibly unwieldy and statistically noisy. Image reduction is the standardized process of summarizing an `ImageCollection` over a specific temporal window, such as a single month, a climatic season, or a full calendar year, into a single, consolidated output image. Common statistical reducers in GEE include calculating the mean, median, minimum, maximum, or specific percentile pixel values.
For example, generating a monthly median composite effectively removes transient noise (like rapidly moving cloud shadows or ephemeral sensor glitches) and provides a highly clean, representative image for that specific time period. Medoid compositing is another highly advanced, multidimensional technique where the exact pixel closest to the multi-dimensional median across all spectral bands is selected. This ensures that the spectral integrity of the pixel is completely maintained, as opposed to simple median reducers which might accidentally synthesize non-existent spectral signatures by taking median values independently across different bands.
Vegetation Indices and Spectral Transformations
Transforming raw spectral reflectance bands into dedicated, ratio-based indices is a standard, highly effective practice to highlight specific environmental features while aggressively suppressing background noise. The Normalized Difference Vegetation Index (NDVI) is undeniably the most universally used metric for assessing vegetation health, overall biomass, and canopy density. By calculating NDVI for every single image in a time series stack, researchers can plot a continuous temporal profile that dynamically reveals the phenological cycle of a forest ecosystem or a commercial agricultural crop field. But NDVI is just the very beginning of spectral transformation. Other highly useful transformations include the Enhanced Vegetation Index (EVI) for assessing dense tropical canopy regions without saturation, the Normalized Difference Water Index (NDWI) for tracking surface water dynamics and severe drought conditions, and the Normalized Burn Ratio (NBR) for assessing wildfire severity and the subsequent, long-term ecological recovery over the years following the destructive blaze.
Anomaly Detection and Z-Scores
Anomaly detection involves systematically and statistically identifying deviations from a historically normal or mathematically expected baseline. In Google Earth Engine, this is most often achieved by meticulously calculating the long-term historical mean and the standard deviation for a specific reference period (e.g., the month of July calculated over a 20-year reference period). Current, incoming observations are then strictly compared against this established historical baseline to accurately calculate a standardized Z-score for each pixel. Extremely high negative or positive Z-scores indicate a highly significant environmental anomaly, which could logically correspond to severe, localized events such as extreme agricultural drought, catastrophic river flooding, or highly unseasonal vegetation blooming caused by shifting weather patterns. This statistical methodology is highly capable for establishing automated early warning systems and rapidly directing disaster response efforts to the most severely impacted geographic areas around the globe.
Advanced Methodologies in Time Series Analysis
For more sophisticated and scientifically demanding analyses, basic temporal reductions and simple mathematical index calculations are often not sufficient. Leading researchers constantly turn to highly advanced mathematical modeling to decouple complex, overlapping spectral signals, such as successfully separating gradual climate-induced environmental shifts from sudden, catastrophic anthropogenic disturbances like clear-cutting.
Harmonic Modeling and Fourier Transforms
Many natural, biological phenomena, particularly seasonal vegetation growth cycles and winter snow accumulation, exhibit strong, highly predictable seasonal cycles. Harmonic modeling uses trigonometric sine and cosine functions to mathematically and elegantly describe this inherent seasonality. By fitting a complex harmonic model to an NDVI time series using multiple linear regression techniques directly within the Google Earth Engine environment, an analyst can accurately extract the amplitude (representing the absolute difference between the peak vegetation and the annual mean) and the phase (indicating the exact timing of the peak vegetation within the year). Subtle but consistent changes in these harmonic parameters over consecutive years can reveal highly critical shifts in ecosystem phenology caused by global climate change, such as an increasingly earlier onset of spring green-up or a significantly delayed autumn senescence.
The LandTrendr Algorithm
LandTrendr (which stands for Landsat-based Detection of Trends in Disturbance and Recovery) is a highly sophisticated, rigorously tested set of spectral-temporal segmentation algorithms specifically designed for the vast Landsat historical archive. It ingeniously simplifies a noisy, highly variable inter-annual time series into a simplified sequence of straight-line segments, also known as vertices. This unique trajectory segmentation allows researchers to pinpoint the exact year a sudden, severe disturbance occurred (e.g., commercial logging operations, aggressive insect defoliation, or massive forest fires) and accurately track the gradual rate of ecological recovery over the subsequent decades. Ported directly into the GEE API by its original creators, LandTrendr has quickly become an absolutely indispensable, foundational tool for national forest management agencies, strict carbon accounting frameworks, and wide-scale ecological conservation initiatives globally.
BFAST (Breaks For Additive Season and Trend)
BFAST is an iterative, mathematically intensive time-series algorithm that meticulously decomposes a temporal signal into three distinct components: the long-term trend, the seasonal cycle, and the remainder (or statistical noise). It is particularly adept at detecting sudden, abrupt changes or breakpoints in the trend component while simultaneously accounting for complex, non-linear seasonal variations. Although traditionally considered highly computationally expensive, the integration of BFAST-like logic and advanced methodologies within GEE enables the continuous, uninterrupted monitoring of subtle degradations in fragile ecosystems that might easily be missed by simpler thresholding or basic differencing techniques. It excels remarkably in environments where environmental change is not a single, catastrophic event, but rather a slow series of overlapping, chronic stressors.
Continuous Change Detection and Classification (CCDC)
CCDC currently represents the absolute, bleeding cutting edge of temporal spatial analysis within the Google Earth Engine cloud environment. Unlike traditional monitoring methods that rely heavily on artificially constructed annual or seasonal composites, CCDC operates optimally on all available, uncomposited cloud-free observations across the entire, dense time series. It continuously builds a robust harmonic regression model for every single pixel in the image and constantly compares new, incoming satellite observations against the model's forward statistical predictions. When a new observation deviates significantly from the statistical prediction over several consecutive dates, a definitive "break" or change event is permanently recorded in the system. This highly complex, data-heavy methodology allows for near real-time detection of rapid land cover changes, making it exceptionally ideal for monitoring illegal deforestation activities, rapid urban expansion, and continuous agricultural modifications.
Specific Use Cases for Temporal Analysis
The highly advanced methodologies described above are not merely academic, theoretical exercises; they have profound, highly impactful real-world applications across a massive multitude of scientific disciplines and commercial industries. Let us explore several key domains where Earth Engine's temporal capabilities are making a truly significant impact on a global scale.
Agricultural Monitoring and Precision Farming
In the expansive field of agriculture, deep time series analysis is completely transforming how we fundamentally understand crop health and predict final harvest yields. By continuously tracking the NDVI or EVI over an entire growing season, agricultural scientists and farmers can identify exactly when crops reach their maximum peak biomass. Any sudden deviations from historical, expected growth curves can provide highly valuable early warnings of devastating pest infestations, severe soil nutrient deficiencies, or critical water stress. Also, by actively utilizing high-resolution Sentinel-2 time series data, commercial precision farming applications can deliver targeted, localized interventions, thereby heavily optimizing the use of expensive fertilizers and scarce irrigation water at the sub-field level, maximizing overall yields while significantly minimizing harmful environmental impacts.
Water Resource Management
Monitoring the complex dynamics of surface water is absolutely critical for regional drought assessment, effective flood mitigation, and general, sustainable water resource management. Earth Engine allows hydrologists and environmental engineers to smoothly apply sophisticated algorithms like the NDWI across multiple decades of historical Landsat data to accurately track the shrinking or expanding of vital lakes, massive reservoirs, and complex river systems. By deeply analyzing the statistical frequency and overall duration of inundation events, researchers can precisely map historic floodplains and effectively model future flood risks under various, highly complex climate change scenarios. This continuous temporal monitoring is utterly essential for growing municipalities actively managing drinking water supplies and for international governing bodies overseeing highly sensitive transboundary water agreements.
Urbanization and Land Cover Change
As the global human population rapidly shifts towards increasingly dense urban centers, meticulously monitoring the expansion of cities is crucial for maintaining sustainable development goals. Deep time series analysis enables urban planners and city officials to accurately quantify the exact, historical rate of land conversion from natural, pristine ecosystems or productive agricultural lands to highly impervious surfaces like dense concrete and sprawling asphalt. By systematically applying spectral mixture analysis over a massive time stack, analysts can easily track the gradual, often unnoticed densification of urban areas. This robust temporal data is incredibly vital for accurately modeling dangerous urban heat island effects, planning future municipal infrastructure, and actively ensuring that city expansion strictly complies with established environmental zoning regulations.
Implementing Time Series Analysis in GEE
Fully understanding the theoretical foundations is only half the battle; successfully implementing these highly advanced concepts requires a rock-solid grasp of the GEE API, its functional programming paradigms, and its unique, highly distributed client-server architecture. Because Earth Engine inherently relies on sending instructions to remote Google servers rather than processing data locally, scripts must be heavily optimized to ensure complex computations run efficiently and do not result in frustrating memory limit errors or abrupt execution timeouts.
Setting Up Your Workspace
The GEE JavaScript Code Editor is universally recognized as the most common, highly accessible starting point for spatial analysts of all skill levels. It provides a highly interactive web-based environment complete with a dynamic map viewport, a powerful syntax-highlighting script editor, and a highly useful console for debugging raw outputs. Strictly organizing your code into discrete, modular functions, such as a dedicated, reusable cloud masking function, a streamlined index calculation wrapper, and a dynamic charting utility, is considered an absolute essential best practice for code maintainability and sharing. Conversely, when working extensively with the Python API, data analysts often leverage powerful Jupyter Notebooks smoothly combined with the open-source `geemap` library, which brilliantly brings interactive mapping, dynamic charting, and advanced data visualization capabilities directly into the familiar Python data science ecosystem.
Building a Time Series Chart
One of the most highly effective, immediate ways to visually interpret temporal data is by generating dynamic, interactive charts directly within the standard GEE Code Editor interface. Using native, built-in functions like `ui.Chart.image.series` or the highly versatile `ui.Chart.image.seriesByRegion`, users can dynamically plot the average, statistically reduced value of a specific spectral band or computed index over a defined spatial geometry (like a carefully hand-drawn polygon representing a commercial farm or a strictly protected national park). Extensively customizing these charts with highly descriptive titles, properly formatted, readable axis labels, and statistical trendlines provides immediate, highly valuable visual feedback. This allows vigilant analysts to rapidly verify their preprocessing steps, confirm their complex cloud masking logic, and deeply validate their algorithms before executing large-scale, computationally expensive data exports.
Exporting Time Series Data
While GEE is an absolutely unparalleled powerhouse for processing and real-time visualization, you will eventually, inevitably need to export your synthesized, final results for use in local statistical software (like R, Python Pandas, or SPSS), GIS desktop applications (like QGIS or ESRI ArcGIS), or highly custom web dashboards. Earth Engine natively and robustly supports exporting massive amounts of data as tabular datasets (CSV formats) or geospatial rasters (GeoTIFF formats) directly to your personal Google Drive or enterprise Google Cloud Storage buckets. When exporting highly dense time series data, it is absolutely crucial to aggregate your results properly and efficiently using highly optimized regional reducers like `reduceRegion` or `reduceRegions`. Carefully, thoughtfully selecting the scale (spatial resolution) during the export task is incredibly vital to strike a delicate, necessary balance between data accuracy and final file size, ensuring that you do not carelessly exceed memory allocation limits during the intense server-side extraction process.
Challenges and Best Practices
Despite its truly immense power, flexibility, and global reach, Google Earth Engine presents several highly unique, frustrating challenges to developers, researchers, and analysts. Successfully navigating these inherent computational hurdles requires a highly strategic, well-planned approach to script development, strict adherence to functional programming, and smart big data management.
Handling Large Datasets and Memory Limits
Processing a densely packed, massive time series over a truly massive geographic area, such as generating a pristine monthly composite for an entire continent over thirty continuous years, can very easily trigger "user memory limit exceeded" errors in GEE. To decisively avoid this common pitfall, it is absolutely essential to write highly efficient, functional code from day one. Analysts must completely and strictly avoid using standard `for` loops, which execute synchronously and extremely slowly on the client side, rapidly overwhelming the browser's memory. Instead, they must smartly utilize GEE's built-in `map()` functions, which elegantly and automatically parallelize operations asynchronously across thousands of Google's server nodes. Also, intelligently breaking a massive study area into much smaller, manageable geographic tiles and exporting the results sequentially can effectively prevent execution timeouts and ensure highly successful data delivery.
Addressing Data Gaps and Noise
Optical time series datasets are famously, notoriously gappy and highly fragmented due to persistent, shifting cloud cover, especially in humid tropical regions like the vast Amazon basin or Central Africa. Temporal interpolation techniques, such as simple linear interpolation, complex spline fitting, or highly advanced smoothing filters (like the Savitzky-Golay filter), can be mathematically and systematically applied to synthetically fill these frustrating data gaps and construct a continuous, highly readable gap-free temporal profile. But analysts must exercise extreme, deliberate caution not to over-smooth the underlying raw data, as highly aggressive filtering can easily and permanently erase the true phenomenological signal of short-lived, yet highly critical environmental events like flash floods or rapid logging.
Validating Results
No remote sensing analysis, regardless of its mathematical complexity or the pedigree of its author, is ever truly complete without a robust, highly statistically sound validation strategy. Ground truth data, meticulously and expensively collected via direct field surveys, unmanned aerial vehicle (drone) flights, or purchased from very high-resolution commercial imagery providers (such as Maxar, Airbus, or PlanetScope), must be systematically and strictly used to assess the real-world accuracy of your Earth Engine time series models. Constructing highly comprehensive confusion matrices and calculating rigorous, universally accepted metrics such as Overall Accuracy, User's/Producer's Accuracy, and the Kappa coefficient are absolutely standard procedures that lend necessary scientific credibility, peer-review readiness, and defensibility to your finalized findings.
The Future of Earth Observation and Time Series
The underlying methodologies surrounding spatial-temporal analysis are continuously, rapidly, and exponentially evolving. As satellite sensor technology inherently improves, temporal revisit times shrink to daily or sub-daily intervals, and computational limits exponentially expand via cloud infrastructure, the absolute scope of what is strictly possible within the massive Google Earth Engine ecosystem grows at a truly breathtaking pace.
Integration with Deep Machine Learning
The rapid convergence of massive time series analysis and deep machine learning is undoubtedly the most exciting, highly promising frontier in modern remote sensing. GEE now smoothly, natively integrates with powerful platforms like Google Vertex AI and TensorFlow, allowing cutting-edge researchers to train incredibly complex deep learning models directly on immense, multidimensional temporal datasets. Advanced, highly sophisticated architectures such as Recurrent Neural Networks (RNNs), Long Short-Term Memory (LSTM) networks, and 3D Convolutional Neural Networks are particularly well-suited for extracting highly hidden, non-linear patterns from sequential satellite imagery. These sophisticated models can accurately, reliably predict future environmental states, such as forecasting national crop yields months before the actual harvest begins, or dynamically predicting the rapid spread of intense wildfires based on a mix of historical climate variables and highly current topological data.
Real-Time Monitoring and Alert Systems
As agile commercial satellite constellations like Planet deliver absolutely unparalleled daily, high-resolution global coverage, the entire remote sensing industry focus is rapidly and permanently shifting from purely historical, retrospective analysis to proactive, real-time continuous monitoring. By smartly deploying continuously automated GEE scripts on Google Cloud Functions or utilizing integrated, serverless webhooks, forward-thinking organizations can effortlessly build highly continuous monitoring systems that smoothly trigger instant, automated alerts the very moment a significant environmental anomaly is successfully detected. This revolutionary, cloud-native capability is actively transforming diverse, massive industries ranging from highly optimized global supply chain management to strict international environmental law enforcement, finally allowing authorities to actively intervene in illegal activities as they occur in real-time rather than simply documenting the damage months after the tragic fact.
Conclusion
Mastering the truly intricate complexities of temporal spatial data opens up a vast, incredibly exciting universe of possibilities for deeply understanding, accurately tracking, and reliably predicting the highly complex dynamics of our constantly changing planet. By intelligently and strategically leveraging the immense, unparalleled computational power and massive data catalogs of Google Earth Engine, spatial analysts and environmental researchers can completely and permanently bypass traditional, limiting hardware constraints. This incredibly liberating technological shift allows them to focus all of their intellectual energy on what truly matters: extracting deep, highly actionable intelligence from decades of continuous, invaluable Earth observation data.
Whether you are mathematically, rigorously modeling the highly subtle harmonic shifts of a rapidly warming global climate, utilizing the powerful, highly regarded LandTrendr algorithm to precisely map forest recovery and quantify carbon sequestration, or deploying highly sophisticated, near real-time CCDC models to monitor rapid land use conversion and sprawling urban development, the highly advanced methodologies outlined in this deeply guide provide a tremendously solid, thoroughly tested foundation for your ongoing and future research endeavors.
The challenging journey to true, undeniable proficiency in advanced remote sensing requires immense patience, a highly rigorous foundational understanding of physical geospatial principles, and a strong willingness to continuously experiment with new, cutting-edge code paradigms. As you continuously refine your robust preprocessing pipelines, heavily optimize your temporal reductions for fast server-side execution, and actively begin to integrate highly advanced machine learning frameworks into your workflows, you will undoubtedly unlock the full, unparalleled potential of this truly revolutionary planetary-scale platform. The profound ability to look back deep in time, accurately analyze the present state, and reliably model the future heartbeat of the Earth from space is not merely a stunning, impressive technical achievement; it is an absolutely vital, non-negotiable tool for actively preserving, managing, and safeguarding our fragile, shared global environment for all future generations.
Frequently Asked Questions
Why use Google Earth Engine for time-series analysis?
Google Earth Engine (GEE) houses a massive multi-petabyte catalog of historical satellite imagery. Its cloud computing architecture allows users to analyze decades of Earth observation data in seconds without downloading any files.
What is an Image Collection in Earth Engine?
An Image Collection is a stack or time series of satellite images. GEE allows users to filter these collections by date, spatial bounds, and cloud cover, and then apply algorithms to the entire stack simultaneously.
How do you handle clouds in a satellite time series?
In GEE, you can write a cloud-masking function using the Quality Assessment (QA) band of the imagery (like Landsat or Sentinel-2) and map that function over the entire Image Collection to remove cloudy pixels before analysis.
