GIS Fundamentals: Working with Spatial Data
Table of Contents
- 1. Introduction to Geographic Information Systems (GIS)
- 2. Spatial Data Models: Vector and Raster Architectures
- 2.1 The Vector Data Model
- 2.2 The Raster Data Model
- 3. Coordinate Reference Systems (CRS) and Projections
- 4. Topology and Spatial Relationships
- 5. Spatial Analysis and Advanced Algorithms
- 5.1 Geoprocessing and Overlay Operations
- 5.2 Spatial Interpolation
- 5.3 Network Analysis
- 6. Modern Data Acquisition: Remote Sensing and LiDAR
- 7. Real-world Applications of Spatial Analysis
- 8. Future Trends: AI, Cloud Native GIS, and Digital Twins
- 9. Conclusion
- Frequently Asked Questions
rsandgis.me
1. Introduction to Geographic Information Systems (GIS)
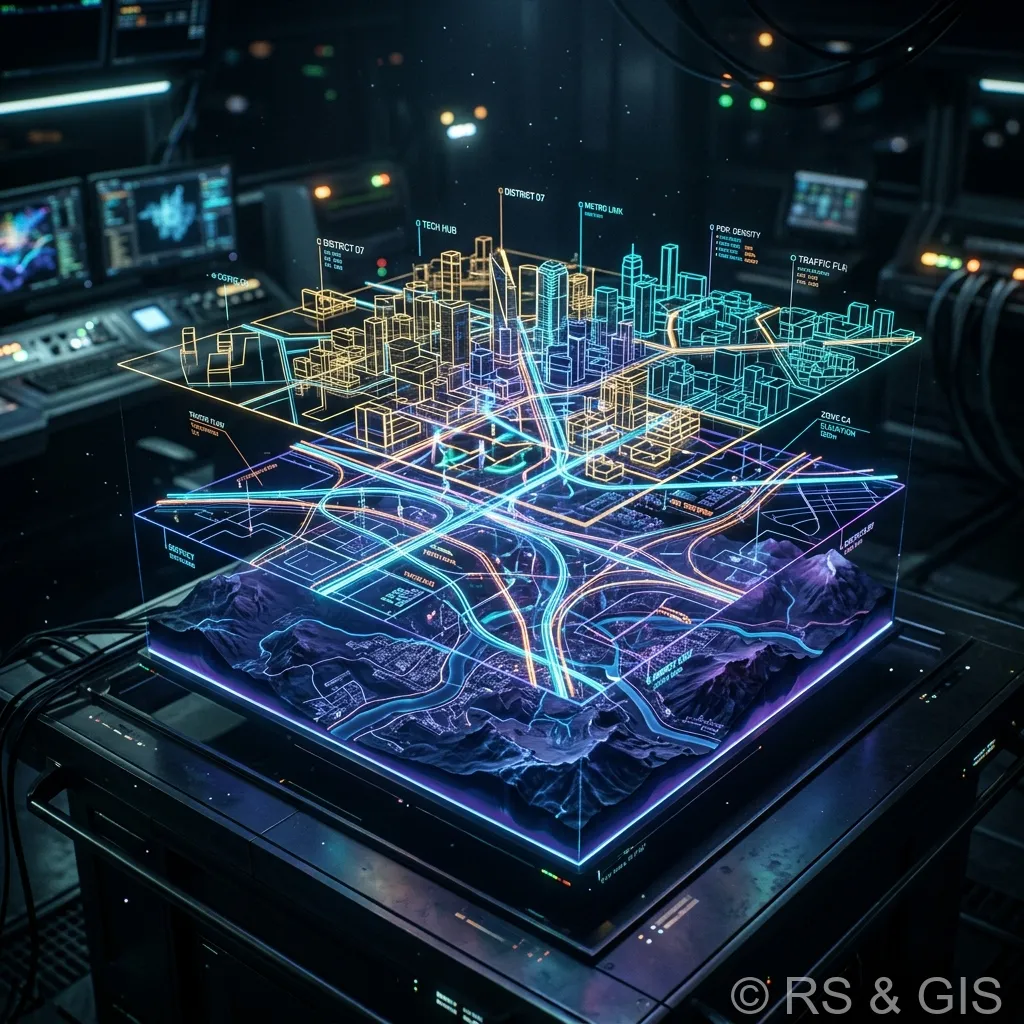
Geographic Information Systems (GIS) represent a profound convergence of cartography, statistical analysis, and computer science. Fundamentally, GIS provides a framework for gathering, managing, and analyzing spatial and geographic data. By anchoring data to specific locations on the Earth's surface, GIS enables professionals across diverse fields to uncover hidden patterns, analyze complex spatial relationships, and make data-driven decisions that shape our world.
The fundamental power of GIS lies in its ability to integrate disparate datasets based on their shared spatial context. Whether tracking the spread of an infectious disease, optimizing supply chain logistics, or modeling the impacts of climate change on coastal infrastructure, GIS serves as the analytical engine that transforms raw data into actionable intelligence.
2. Spatial Data Models: Vector and Raster Architectures
The digital representation of geographic phenomena necessitates robust data models capable of capturing both discrete entities and continuous surfaces. The two primary spatial data models employed in GIS are the vector and raster models, each optimized for specific types of data and analytical operations.
2.1 The Vector Data Model
The vector data model represents the world using discrete geometric primitives: points, lines, and polygons (or areas). These primitives are defined by a series of coordinate pairs (X, Y, and optionally Z for elevation) within a defined spatial reference system.
- Points: Represent zero-dimensional objects with location but no spatial extent, such as a well, a survey monument, or an individual tree.
- Lines (Polylines): Represent one-dimensional objects defined by a sequence of connected points, illustrating linear features like roads, rivers, or utility networks.
- Polygons: Represent two-dimensional objects defined by a closed sequence of lines, capturing areas with distinct boundaries, such as land parcels, lakes, or political jurisdictions.
Vector data excels at representing features with well-defined boundaries and maintaining high spatial accuracy regardless of scale. Also, vector data structures readily support complex topological rules and network analysis.
2.2 The Raster Data Model
In contrast, the raster data model represents geographic space as a continuous grid of equally sized cells or pixels. Each cell contains a value representing a specific attribute or measurement at that location. Raster data is ideally suited for representing continuous spatial phenomena that lack distinct boundaries.
- Elevation (DEMs): Digital Elevation Models utilize raster grids where each cell value represents the terrain height above a specific datum.
- Satellite Imagery: Optical and radar imagery acquired by Earth observation satellites are inherently raster datasets, capturing reflectance or backscatter values.
- Temperature Gradients: Continuous environmental variables like temperature, precipitation, or soil moisture are efficiently modeled using raster grids.
While raster data is computationally efficient for overlay analysis and modeling continuous surfaces, it is constrained by spatial resolution (the geographic area represented by a single cell), which dictates the level of detail captured.
3. Coordinate Reference Systems (CRS) and Projections
A crucial, often misunderstood, component of GIS is the accurate spatial referencing of data. Because the Earth is a complex, irregular three-dimensional shape (approximated as an oblate spheroid or ellipsoid), mathematically translating this curved surface onto a flat two-dimensional map requires a Coordinate Reference System (CRS) and a map projection.
A CRS defines how spatial coordinates relate to actual locations on the Earth. It comprises two main components:
- Geographic Coordinate System (GCS): Defines locations on the 3D surface using angular measurements (latitude and longitude) relative to an established datum (e.g., WGS 84, NAD83).
- Projected Coordinate System (PCS): Applies a mathematical transformation (map projection) to project the 3D GCS coordinates onto a flat 2D plane (e.g., Universal Transverse Mercator - UTM).
Every map projection inevitably introduces distortion in at least one of four spatial properties: shape, area, distance, or direction. Selecting the appropriate projection is critical and depends entirely on the specific requirements of the analysis.
For instance, an equal-area projection is necessary for calculating land use acreage accurately, while a conformal projection (preserving shape and local angles) is essential for navigation.
4. Topology and Spatial Relationships
In vector GIS, topology refers to the explicit mathematical definition of spatial relationships between geometric features. It governs how point, line, and polygon features share geometry and interact with one another. Unlike simple geometry (which only defines coordinates), topology answers fundamental spatial queries: What is adjacent? What connects to what? What is contained within?
Key topological rules include:
- Adjacency (Contiguity): Identifying polygons that share a common boundary (e.g., neighboring counties).
- Connectivity: Defining how linear features connect at nodes to form networks (e.g., road intersections, utility pipe connections).
- Containment: Determining if a point or polygon lies entirely within the boundaries of another polygon (e.g., a well located within a specific land parcel).
Enforcing topological rules ensures data integrity by preventing errors such as sliver polygons (tiny gaps or overlaps between adjacent polygons), disconnected network segments, and overlapping features. Robust topological models are mandatory for advanced network analysis, such as routing emergency vehicles or tracing the flow of contaminants in a water system.
5. Spatial Analysis and Advanced Algorithms
The true analytical capability of GIS transcends mere visualization. Spatial analysis encompasses a wide array of mathematical and statistical techniques applied to geographic data to extract meaning, identify patterns, and solve complex problems.
5.1 Geoprocessing and Overlay Operations
Geoprocessing involves performing sequential operations on spatial data to create new datasets. A fundamental operation is overlay analysis, where multiple data layers covering the same geographic extent are combined.
For instance, an intersection operation between a 'flood zone' polygon layer and a 'building footprint' polygon layer will generate a new layer identifying only the buildings located within the flood zone.
5.2 Spatial Interpolation
Spatial interpolation is a critical technique used to estimate values at unmeasured locations based on known observations. This is frequently employed when analyzing continuous environmental variables. Common interpolation algorithms include:
- Inverse Distance Weighting (IDW): Assumes that the influence of a known point diminishes with distance. Closer points have a greater weight in the estimation than distant points.
- Kriging: A sophisticated geostatistical method that not only considers the distance between known points but also models the spatial autocorrelation (the statistical relationship between points over distance), providing both estimated values and a measure of uncertainty (variance).
5.3 Network Analysis
Network analysis leverages the topological connectivity of linear features (roads, pipes, cables). Algorithms like Dijkstra's algorithm or the A* search algorithm are used to solve complex routing problems. Applications include calculating the shortest path between two locations, optimizing multi-stop delivery routes (the Traveling Salesperson Problem), and determining service areas or drive-time polygons around a facility.
6. Modern Data Acquisition: Remote Sensing and LiDAR
The proliferation of GIS has been accelerated by revolutionary advancements in spatial data acquisition technologies. Remote sensing, the science of obtaining information about the Earth's surface without physical contact, provides an indispensable source of raster data.
Earth observation satellites (such as Landsat and Sentinel) carry multispectral sensors that capture electromagnetic radiation reflected from the surface across various wavelengths (visible, near-infrared, shortwave infrared). This data is critical for classifying land cover, assessing vegetation health (e.g., using the Normalized Difference Vegetation Index - NDVI), and monitoring urban expansion.
Light Detection and Ranging (LiDAR) is an active remote sensing technology that utilizes laser pulses to measure precise distances to the Earth's surface. Airborne LiDAR systems generate massive point clouds comprising millions of highly accurate 3D coordinates. These point clouds are processed to create ultra-high-resolution Digital Elevation Models (DEMs), map forest canopy structure, and extract 3D building models for urban planning.
7. Real-world Applications of Spatial Analysis
The versatility of GIS has led to its ubiquitous adoption across numerous sectors:
- Urban Planning and Smart Cities: GIS models zoning regulations, analyzes traffic congestion, optimizes public transit routes, and assesses the impact of new developments on existing infrastructure.
- Environmental Management: Analyzing habitat fragmentation, modeling pollutant dispersion in waterways, managing forestry resources, and identifying areas vulnerable to natural hazards like landslides and wildfires.
- Public Health and Epidemiology: Tracking the spatial distribution of disease outbreaks, identifying geographic clusters of illnesses, and analyzing the accessibility of healthcare facilities for vulnerable populations.
- Precision Agriculture: Utilizing drone imagery and soil data to optimize irrigation, apply fertilizers variably, and maximize crop yields while minimizing environmental impact.
8. Future Trends: AI, Cloud Native GIS, and Digital Twins
The future of GIS is rapidly evolving, driven by the integration of emerging technologies.
Artificial Intelligence (AI) and Machine Learning (ML), collectively known as GeoAI, are automating the extraction of features from vast repositories of satellite imagery. Deep learning models can now accurately identify building footprints, road networks, and specific crop types with unparalleled speed, dramatically accelerating data creation and analysis.
Cloud Native GIS is shifting the paradigm from desktop-centric workflows to scalable, web-based architectures. Platforms leveraging cloud computing facilitate the storage of petabytes of spatial data and enable distributed geoprocessing, allowing organizations to perform complex analyses without requiring immense local computational resources.
Also, the concept of the Digital Twin is gaining profound traction. A spatial digital twin is a dynamic, highly detailed virtual replica of a physical environment, integrating real-time sensor data (IoT) with 3D GIS models. This allows urban planners and engineers to simulate different scenarios, test policies, and predict outcomes in a safe, virtual environment before implementing changes in the real world.
9. Conclusion
Working with spatial data necessitates a rigorous understanding of the underlying principles of GIS. From mastering the nuances of vector and raster data models and navigating complex coordinate reference systems to applying sophisticated spatial interpolation and topological algorithms, GIS is a profoundly technical discipline. As spatial data becomes increasingly abundant and technologies like GeoAI and cloud computing mature, the ability to effectively manage and analyze this data will remain an essential skill for solving some of the world's most complex geographic and environmental challenges.
Frequently Asked Questions
What is a Geographic Information System (GIS)?
A GIS is a computer system designed to capture, store, manipulate, analyze, manage, and present all types of spatial or geographical data, allowing us to understand patterns, relationships, and geographic context.
What is spatial analysis?
Spatial analysis involves applying mathematical and geometric operations to geographic data to extract new insights. Examples include calculating the shortest route, finding the intersection of two zones, or determining the density of events in an area.
What is the difference between spatial and non-spatial data?
Spatial data includes explicit geographic coordinates or geometries (where something is). Non-spatial data (attribute data) describes the characteristics of those features (e.g., the name of a road, the population of a city, or the temperature).
