What is Geographic Information System (GIS)? Meaning & Basics
Table of Contents
- Introduction: Unlocking the Power of Location Data
- 1. The True Meaning of GIS: Beyond Digital Maps
- 2. How GIS Works: The Science of Layering Data
- 3. The Five Core Components of a GIS
- A. Hardware
- B. Software
- C. Data
- D. Methods (Procedures)
- E. People
- 4. Understanding GIS Data: Vector vs. Raster
- Vector Data
- Raster Data
- 5. The Magic of GIS: Spatial Analysis
- A. Proximity Analysis
- B. Overlay Analysis
- C. Network Analysis
- D. Spatial Interpolation
- 6. Real-World Applications of GIS Across Industries
- Urban Planning and Government
- Environmental Management and Conservation
- Public Health and Epidemiology
- Business, Retail, and Marketing
- Emergency Management and Disaster Response
- 7. The Future of GIS: Where Are We Heading?
- A. Integration with Artificial Intelligence (GeoAI)
- B. Web GIS and Cloud Computing
- C. 3D GIS and Digital Twins
- D. Real-Time GIS and the Internet of Things (IoT)
- Conclusion: The Indispensable Role of Location Intelligence
- Frequently Asked Questions
rsandgis.me
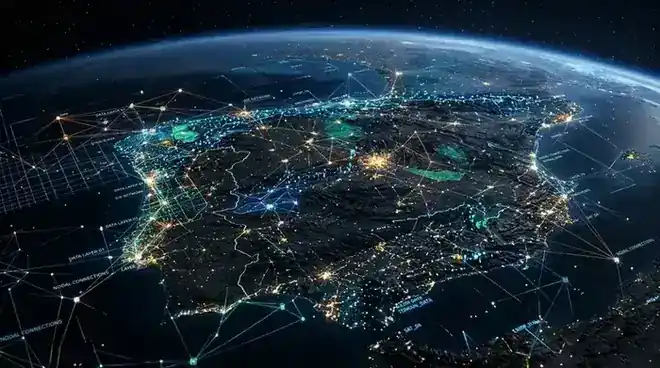
A complete, in-depth guide to understanding Geographic Information Systems, spatial data, and how location intelligence is transforming the modern world.
Introduction: Unlocking the Power of Location Data
In our increasingly interconnected and data-driven world, almost every piece of information generated has a location attached to it. Whether it is a delivery truck navigating congested city streets, an epidemiologist tracking the localized spread of a virus, an environmental scientist monitoring regional deforestation rates, or a retail chain deciding where to open its next flagship store—location is the universal common denominator. This profound intersection of data and geography is exactly where the Geographic Information System (GIS) steps in.
But what is GIS exactly? To put it simply, a Geographic Information System is a powerful technological framework designed for gathering, managing, analyzing, and visualizing spatial and geographic data. It roots all information in the context of geography, enabling users to uncover hidden patterns, analyze complex relationships, and gain actionable intelligence that would be impossible to extract from a traditional, flat spreadsheet.
Through the integration of sophisticated mapping technology with robust database management systems, GIS bridges the gap between visual mapping and statistical analysis. This comprehensive, 2000-word guide will walk you step-by-step through the meaning of GIS, its fundamental basics, its core operational components, the diverse types of spatial data it relies upon, and how this location intelligence technology is revolutionizing a vast array of industries across the globe.
1. The True Meaning of GIS: Beyond Digital Maps
When many people hear the term "GIS," they immediately think of Google Maps or the GPS navigation system on their smartphones. While those are indeed ubiquitous consumer applications built on GIS technology, true GIS is far more profound and complex than just getting directions from point A to point B.
The acronym GIS stands for Geographic Information System. Let's break down these three foundational pillars to truly understand its meaning:
- Geographic: This refers to the spatial component. It involves data that is intrinsically linked to a specific physical location on the Earth's surface (often identified by coordinates like latitude and longitude).
- Information: This represents the attribute data—the descriptive details about the geographic features being mapped. For a road, the attribute data might include its name, speed limit, surface type, and traffic volume.
- System: This represents the interconnected technological infrastructure—the combination of computer hardware, specialized software algorithms, data storage, and the human expertise required to process and interpret the information.
Therefore, GIS is a system that creates, manages, analyzes, and maps all types of data. It connects the "where" (location) with the "what" (descriptive information). By layering these different datasets on top of one another within a digital mapping environment, GIS provides a multidimensional view of our world, transforming static maps into dynamic, interactive analytical tools.
2. How GIS Works: The Science of Layering Data
To grasp the basics of how a Geographic Information System functions, it is helpful to visualize it as a sophisticated digital sandwich. Unlike traditional paper maps that flatten all information into a single, static image, GIS technology organizes different types of geographic information into distinct, independent layers.
Each layer represents a specific category of geographic or attribute data. For example, a city's GIS model might consist of the following data layers:
- Base Map Layer: High-resolution satellite imagery or a topological map serving as the foundational background.
- Street Network Layer: All roads, highways, and paths, often containing routing and speed limit data.
- Zoning Layer: Polygons detailing commercial, residential, and industrial zones.
- Utility Infrastructure Layer: Lines and points representing water pipes, electrical grids, and sewer systems.
- Demographic Layer: Census data showing population density, income levels, and age distribution.
By selectively stacking, viewing, and comparing these layers, GIS professionals can perform complex spatial analysis. For instance, a city planner could overlay the demographic layer (showing high-density populations of elderly citizens) with the utility layer (showing public transportation routes) and a healthcare layer (showing hospital locations) to determine if medical services are adequately accessible to the most vulnerable populations.
3. The Five Core Components of a GIS
A fully functioning Geographic Information System is not merely a software program you install on a computer. It is a holistic ecosystem comprised of five critical, interdependent components. Without any one of these pillars, the system cannot function at its full potential.
A. Hardware
Hardware is the physical equipment on which a GIS operates. Historically, GIS required massive, specialized mainframe computers. Today, the landscape has evolved significantly. GIS software can run on a wide spectrum of hardware, ranging from high-performance desktop workstations and dedicated enterprise servers to cloud computing networks and even mobile smartphones and tablets used for field data collection.
B. Software
GIS software provides the graphical user interface (GUI) and the underlying analytical tools needed to input, store, analyze, and display spatial data. Industry-leading proprietary software includes Esri's ArcGIS suite, which dominates the enterprise market. However, robust open-source alternatives like QGIS (Quantum GIS) have gained immense popularity, offering powerful geospatial capabilities without the prohibitive licensing costs. Key software components include database management systems (DBMS), graphical rendering engines, and geoprocessing toolboxes.
C. Data
Data is arguably the most crucial and expensive component of any GIS project. Without accurate, up-to-date data, the system is useless—a concept known as "garbage in, garbage out." GIS relies on the seamless integration of spatial data (the geometric representation of features) and tabular attribute data (the descriptive information about those features). Data can be sourced from satellite imagery, aerial surveys, GPS field data collection, digitized paper maps, and massive governmental or commercial databases.
D. Methods (Procedures)
A successful GIS operates according to well-designed plans, business rules, and analytical models, which are unique to each organization. Methods refer to the standardized procedures and workflows established to ensure data quality, analytical consistency, and operational efficiency. This includes protocols for data entry, quality assurance (QA) checks, update frequencies, and specific spatial analysis methodologies tailored to the organization's overarching goals.
E. People
GIS technology is only as effective as the people who manage and use it. The human element ranges from highly trained GIS specialists, spatial data scientists, and cartographers who design and maintain the system, to the end-users (like city planners, logistics managers, and environmental researchers) who utilize the final maps and analytical outputs to make informed, strategic decisions.
4. Understanding GIS Data: Vector vs. Raster
In the realm of GIS, geographic data is fundamentally categorized into two primary spatial data models: Vector and Raster. Understanding the distinction between these two formats is essential for anyone diving into the basics of geospatial analysis.
Vector Data
Vector data represents the world using distinct geometric shapes based on mathematical coordinates (X and Y). It is ideal for defining features with clear, discrete boundaries. Vector data is broken down into three geometric types:
- Points: Used to represent distinct, zero-dimensional locations where the exact shape is not relevant at the given scale. Examples include light poles, individual trees, well locations, or specific addresses.
- Lines (Arcs): One-dimensional features representing linear entities that have length but no area. Examples include roads, rivers, contour lines, and utility pipelines.
- Polygons: Two-dimensional enclosed areas representing features that have both perimeter and geographic area. Examples include property parcels, country borders, lakes, and zoning districts.
Vector data is highly scalable and maintains crisp edges regardless of how much you zoom in, making it perfect for precise mapping and detailed spatial queries.
Raster Data
Raster data, on the other hand, represents the world as a continuous grid of equally sized cells or pixels. Each pixel holds a specific numeric value representing the condition of the geographic area covered by that cell. Raster data is perfectly suited for modeling continuous phenomena that lack clear boundaries.
Common examples of raster data include:
- Satellite Imagery and Aerial Photography: Where each pixel represents a color value reflecting the light off the Earth's surface.
- Digital Elevation Models (DEMs): Where each pixel contains a specific elevation value, allowing for 3D terrain modeling and slope analysis.
- Temperature and Precipitation Maps: Where pixel values represent climatic measurements interpolated across a vast area.
While raster data is excellent for continuous surface analysis, it can consume massive amounts of computer storage space, and its resolution is strictly limited by the size of its individual pixels.
5. The Magic of GIS: Spatial Analysis
The true power of GIS lies not just in making pretty maps, but in spatial analysis. This is the process of extracting or creating new information from spatial data to solve complex problems, evaluate suitability, and predict future outcomes. Some of the core analytical functions of GIS include:
A. Proximity Analysis
Answering questions about what is near what. Buffering is a classic proximity tool. For example, a city might create a 500-foot buffer zone around all local schools to mandate drug-free or alcohol-free zones, instantly identifying which commercial properties fall within that restricted perimeter.
B. Overlay Analysis
The process of superimposing multiple data layers to find intersections or overlapping criteria. For example, an agricultural company looking for optimal farmland might overlay layers containing soil quality, average rainfall, and land slope to pinpoint the exact geographic regions that meet all three conditions for a specific crop.
C. Network Analysis
Analyzing routing and connectivity along linear networks (like roads or pipes). Logistics companies like UPS and FedEx rely heavily on GIS network analysis to optimize complex delivery routes, minimizing travel time and fuel consumption while factoring in one-way streets, speed limits, and historical traffic patterns.
D. Spatial Interpolation
Estimating values for unknown areas based on known data points. If you have pollution sensors scattered across a city, GIS can use interpolation algorithms to predict and map the estimated pollution levels for the entire urban area, creating a continuous heat map from discrete point data.
6. Real-World Applications of GIS Across Industries
Because nearly all human activity has a geographic component, the applications of GIS are virtually limitless. It has become a mission-critical technology across both the public and private sectors. Here is a look at how GIS is transforming various industries:
Urban Planning and Government
Municipal governments are among the largest users of GIS. Planners use it for zoning, tracking property tax parcels, designing new infrastructure, and managing public utilities. GIS allows city officials to model the potential impact of new developments, such as how a new shopping mall might affect local traffic congestion or emergency response times.
Environmental Management and Conservation
Environmental scientists rely heavily on GIS to monitor ecosystems, track wildlife migration patterns, manage natural resources, and model the impacts of climate change. GIS is instrumental in analyzing deforestation via satellite imagery, planning sustainable forestry operations, and assessing the environmental impact of proposed construction projects.
Public Health and Epidemiology
The field of public health utilizes GIS to track the spread of infectious diseases, identify health trends, and allocate medical resources efficiently. During the COVID-19 pandemic, GIS dashboards (such as the famous one created by Johns Hopkins University) became the global standard for tracking infection rates, testing locations, and vaccine distribution in real-time on a geographic basis.
Business, Retail, and Marketing
In the private sector, GIS powers Location Intelligence. Retailers use GIS for site selection, analyzing demographic data, foot traffic, and competitor locations before opening a new store. Marketers use spatial data to understand consumer behavior regionally and launch highly targeted, geo-fenced advertising campaigns.
Emergency Management and Disaster Response
When natural disasters strike—be it a hurricane, wildfire, or earthquake—GIS provides critical situational awareness. Emergency managers use GIS to map evacuation routes, track the perimeter of wildfires, predict flood inundation zones, and coordinate the deployment of first responders to the areas of most critical need based on real-time spatial data.
7. The Future of GIS: Where Are We Heading?
The GIS industry is experiencing a period of rapid, unprecedented innovation. As technology evolves, GIS is becoming more integrated, intelligent, and accessible. Several key trends are shaping the future of geospatial technology:
A. Integration with Artificial Intelligence (GeoAI)
Geospatial Artificial Intelligence (GeoAI) is revolutionizing how we process spatial data. Machine learning algorithms can now rapidly analyze massive volumes of satellite imagery to automatically identify features—like extracting every building footprint in a city or assessing roof damage across thousands of homes immediately following a hurricane, a task that would take humans months to complete manually.
B. Web GIS and Cloud Computing
GIS is moving aggressively from desktop silos to the cloud. Web GIS allows organizations to host massive datasets on centralized cloud servers, enabling multiple users across the globe to access, edit, and analyze the same map simultaneously through standard web browsers. This democratization of data ensures that spatial insights are no longer locked away with GIS specialists but are accessible to everyday decision-makers.
C. 3D GIS and Digital Twins
Traditional 2D mapping is giving way to immersive 3D GIS. The concept of the "Digital Twin"—a highly accurate, virtual 3D replica of a physical city or infrastructure network—is gaining immense traction. 3D GIS allows urban planners to visualize how a proposed skyscraper will alter the city skyline, cast shadows, and impact local wind patterns before a single shovel hits the ground.
D. Real-Time GIS and the Internet of Things (IoT)
With billions of IoT sensors constantly streaming data from smartphones, vehicles, smart meters, and weather stations, GIS is shifting from analyzing historical data to analyzing real-time data streams. Modern GIS dashboards can ingest and map live data, allowing organizations to monitor assets, track moving fleets, and respond to incidents the second they occur.
Conclusion: The Indispensable Role of Location Intelligence
To ask "What is GIS?" is to ask how we interpret the complex, interconnected world around us. A Geographic Information System is no longer a niche, specialized tool relegated to back-office cartographers. It is a dynamic, foundational technology that powers the modern digital economy, guides critical governmental decisions, and helps us confront some of the most pressing global challenges of our time, from urbanization to climate change.
By transforming raw, disparate data points into cohesive, visual narratives, GIS provides us with something invaluable: spatial context. It allows us to see relationships that were previously hidden, to make decisions based on empirical geographic evidence rather than intuition, and to manage our resources, our businesses, and our planet with unprecedented precision and foresight.
Whether you are a student exploring a new career path, a business owner looking to optimize your logistics, or a citizen interested in how your city operates, understanding the basics of GIS and location intelligence is an essential skill for navigating the future. Geography matters, and GIS is the definitive technology that proves it.