Digital Terrain Model (DTM): A Complete Guide
Table of Contents
- Introduction to Digital Terrain Models (DTMs)
- The Difference Between DTM, DEM, and DSM
- Data Acquisition: How are DTMs Created?
- 1. LiDAR (Light Detection and Ranging)
- 2. Photogrammetry and Structure from Motion (SfM)
- 3. Radar Interferometry (InSAR)
- 4. Traditional Ground Surveys
- Data Structures and Formats for DTMs
- Raster Grids
- Triangulated Irregular Networks (TINs)
- Processing and Generating a DTM: From Raw Data to Bare Earth
- Ground Filtering Algorithms
- Interpolation Techniques
- Applications of Digital Terrain Models
- 1. Hydrology and Flood Modeling
- 2. Civil Engineering and Infrastructure Design
- 3. Precision Agriculture and Forestry
- 4. Military and Defense Operations
- Challenges, Quality Assessment, and Future Trends
- Assessing DTM Quality
- Machine Learning in Terrain Modeling
- Conclusion
- Frequently Asked Questions
rsandgis.me
Introduction to Digital Terrain Models (DTMs)
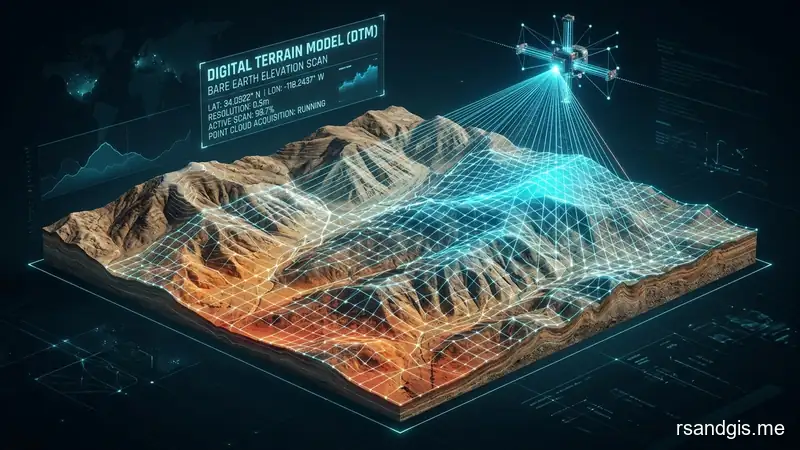
In the expansive and ever-evolving field of Geographic Information Systems (GIS) and remote sensing, understanding the topography of the Earth's surface is fundamental. A Digital Terrain Model (DTM) is a cornerstone of spatial analysis and digital cartography, providing a three-dimensional representation of a terrain's surface, specifically, the bare earth. By computationally removing all above-ground features such as vegetation, buildings, bridges, and vehicles, a DTM offers an uninterrupted view of the natural landscape's structural and elevational characteristics.
The concept of digital terrain modeling (often referred to internationally as terrain modelling) dates back to the late 1950s, when Charles Miller at MIT first coined the term to describe a digital representation of the ground surface for highway design. Since then, DTMs have transitioned from simple grid-based interpolations created using tedious manual ground surveys to highly complex, multi-million-point datasets captured from space-borne sensors. Today, DTMs are indispensable in numerous disciplines, ranging from civil engineering and hydrology to agriculture, forestry, military operations, and environmental conservation.
A dtm digital terrain model essentially records elevation data (the Z-axis) over a continuous two-dimensional coordinate system (the X and Y axes). This data forms the backbone for numerous derivative products.
For instance, once a DTM is generated, analysts can calculate slopes (the steepness of the terrain), aspect (the direction the slope faces), curvature, and hillshades (a grayscale 3D representation of the surface, with the sun's relative position taken into account). These derivatives are critical for analyzing water flow, identifying landslide-prone areas, planning infrastructure projects, and understanding line-of-sight in telecommunications and defense.
Also, the precision and accuracy of a dtm model dictate the reliability of all subsequent analyses. In urban planning, a highly accurate DTM ensures that a new drainage system will flow correctly. In aviation, it guarantees that flight paths clear mountain ridges by safe margins. The continuous advancement in data acquisition technologies, such as Light Detection and Ranging (LiDAR) and high-resolution optical satellite imagery, has exponentially increased the spatial resolution and vertical accuracy of DTMs, making them more valuable than ever before.
The Difference Between DTM, DEM, and DSM
One of the most common points of confusion in geospatial science is distinguishing between a Digital Terrain Model (DTM), a Digital Elevation Model (DEM), and a Digital Surface Model (DSM). While these acronyms are frequently used interchangeably in casual conversation, they represent fundamentally different types of elevation datasets, each serving a distinct purpose in spatial analysis.
Digital Surface Model (DSM): A DSM captures the natural and built features on the Earth’s surface. It represents the absolute highest elevation point at any given geographic coordinate. If a laser pulse hits the top of a tree canopy, the roof of a skyscraper, or a power line, that elevation is what is recorded in the DSM. As a result, a DSM is a "first-return" representation. It is incredibly useful in urban planning to determine building heights, in forestry to calculate canopy volume, in aviation to identify obstacles, and in telecommunications to perform viewshed and line-of-sight analysis where buildings and trees might block signals.
Digital Terrain Model (DTM): In contrast to a DSM, a surface digital terrain model (dtm) represents the bare-earth surface. To create a DTM, all non-ground features, such as trees, buildings, and infrastructure, must be digitally filtered out and removed. If a DSM shows a dense forest as a high, uneven plateau, the corresponding DTM will show the undulating ground beneath the trees. DTMs are crucial for any application that relies on the physical ground, such as flood modeling, drainage analysis, geological mapping, and civil engineering earthwork calculations. A DTM usually includes breaklines, lines that define distinct changes in the terrain, such as ridges, valleys, and the edges of water bodies, making it a highly accurate topographic map.
Digital Elevation Model (DEM): The term DEM is often used as a generic umbrella term encompassing both DSMs and DTMs. A DEM simply implies a digital representation of continuous elevation values over a topographic surface by a regular array of z-values. But in specific contexts, particularly in the United States, as defined by the USGS, a DEM strictly refers to a bare-earth raster grid without breaklines. In other parts of the world, DEM is used generically, and users must specify whether they are referring to a surface model (DSM) or a terrain model (DTM). To ensure clarity in professional GIS workflows, it is always best practice to use DTM when referring to the bare ground and DSM when referring to the top canopy surface.
Understanding these distinctions is paramount. Feeding a DSM into a flood inundation model, for example, would yield disastrously inaccurate results, as the model would interpret forests and buildings as solid, impermeable terrain blocking the flow of water. Conversely, using a DTM for cell tower placement would fail to account for the signal-blocking effects of surrounding trees and skyscrapers.

Data Acquisition: How are DTMs Created?
The creation of a high-fidelity Digital Terrain Model begins with accurate data acquisition. Over the decades, the methods for capturing elevation data have evolved from labor-intensive field surveys to advanced, automated remote sensing technologies. Today, the choice of acquisition method depends on the required spatial resolution, accuracy, budget, and the geographic extent of the project area. The four primary methods of capturing terrain data are LiDAR, Photogrammetry, Radar, and traditional Ground Surveys.
1. LiDAR (Light Detection and Ranging)
LiDAR is widely considered the gold standard for generating highly accurate bare-earth DTMs, particularly in vegetated areas. Airborne LiDAR sensors emit hundreds of thousands of laser pulses per second toward the Earth's surface. As these light pulses travel through the air, some hit the top of the forest canopy, some hit the branches, and a fraction manages to penetrate through the gaps in the foliage to reach the bare ground. The sensor records the time it takes for each pulse to bounce back, calculating the exact distance and elevation.
Because a single LiDAR pulse can return multiple signals (e.g., first return from the canopy, second from a branch, last return from the ground), analysts can isolate the "last returns" to strip away the vegetation. This capability makes LiDAR unparalleled for DTM generation in forested regions, where optical cameras would only see the tops of the trees. Also, drone-based (UAV) LiDAR has democratized this technology, allowing for hyper-local, centimeter-level accuracy without the exorbitant cost of commissioning manned aircraft.
2. Photogrammetry and Structure from Motion (SfM)
Photogrammetry involves capturing overlapping photographs of a landscape from different angles, typically using drones or satellites. Advanced algorithms, such as Structure from Motion (SfM), analyze these 2D images to identify common tie points, mathematically reconstructing the 3D geometry of the scene. This process generates incredibly dense 3D point clouds and textured 3D meshes.
While photogrammetry is highly cost-effective and produces visually stunning surface models, it has a significant limitation when generating DTMs: cameras cannot see through vegetation. If the ground is obscured by dense grass or a forest canopy, the photogrammetric point cloud will only represent the top of that vegetation. To generate a DTM from photogrammetry, analysts must rely on spatial filtering to guess the ground surface beneath the vegetation, which often leads to decreased accuracy in heavily vegetated areas. But in barren landscapes, quarries, or urban environments with clear ground visibility, photogrammetry can rival LiDAR in terms of DTM quality.
3. Radar Interferometry (InSAR)
Synthetic Aperture Radar (SAR) and Interferometric SAR (InSAR) operate by bouncing microwave signals off the Earth's surface. Because microwaves can penetrate clouds and weather, radar is highly effective for global-scale elevation mapping. But standard C-band radar, like the famous Shuttle Radar Topography Mission (SRTM), reflects primarily off tree canopies and vegetation, meaning it produces a Digital Surface Model (DSM) rather than a bare-earth DTM in forested areas. To extract a true DTM from radar, longer wavelengths (like L-band or P-band polarimetric SAR) are required to penetrate the canopy and reach the bare earth.
InSAR calculates elevation by comparing the phase difference between two radar images taken from slightly different positions. While radar is excellent for creating wide-area, medium-resolution DTMs, it generally lacks the hyper-precise, centimeter-level detail provided by localized LiDAR or UAV photogrammetry.
4. Traditional Ground Surveys
Before the advent of remote sensing, DTMs were created using traditional land surveying techniques involving total stations and GPS/GNSS rovers. Surveyors would physically walk the terrain, capturing precise X, Y, and Z coordinates at regular intervals and at critical topographic breaks (breaklines). While this method is extremely time-consuming and practically impossible for large or rugged areas, it remains the most accurate method for capturing localized terrain data. Today, ground surveys are predominantly used to establish Ground Control Points (GCPs) to calibrate and georeference LiDAR and photogrammetry models, ensuring their absolute accuracy relative to the global coordinate system.
Data Structures and Formats for DTMs
Once the raw elevation data is captured and filtered to extract the bare-earth points, it must be structured into a digital format that GIS software can interpret and analyze. The two primary data structures used for Digital Terrain Models are Raster grids and Triangulated Irregular Networks (TINs).
Raster Grids
The raster format is the most ubiquitous structure for DTMs. A raster DTM divides the landscape into a regular grid of square cells, or pixels. Each pixel stores a single numeric value representing the average elevation within that defined area.
For example, in a 1-meter resolution DTM, every pixel represents a 1x1 meter square on the ground. The simplicity of the raster format makes it highly efficient for spatial computations, such as map algebra, slope calculations, and hydrological modeling.
But the raster structure has limitations. Because the grid is uniform, it inherently oversamples flat areas (storing identical elevation values redundantly) and undersamples highly complex, jagged terrain. A raster grid also struggles to accurately represent sharp, sudden changes in elevation, such as retaining walls, curbs, or sharp ridges, because the elevation change is smoothed across the entire pixel. Common file formats for raster DTMs include GeoTIFF (.tif), Esri Grid, and ASCII grid.
Triangulated Irregular Networks (TINs)
To address the limitations of raster grids, the Triangulated Irregular Network (TIN) was developed. A TIN is a vector-based representation of the terrain constructed by connecting raw elevation points to form a contiguous network of non-overlapping triangles (using Delaunay triangulation). The vertices of these triangles are the actual, measured elevation points.
The major advantage of a TIN is its variable resolution. In vast, flat areas like plains or lakes, a TIN will use a few large triangles to represent the terrain, saving file space and processing power. In complex, highly varied terrain, the TIN will generate thousands of tiny triangles to accurately capture the intricacies of the surface. Most importantly, TINs smoothly incorporate breaklines. A breakline forces the triangulation algorithm to draw edges along specific geographic features, such as the edge of a cliff or the center of a riverbed, ensuring that these critical topographic shifts are perfectly preserved rather than smoothed out. TINs are predominantly used in civil engineering and CAD software for precise earthwork volume calculations.
Processing and Generating a DTM: From Raw Data to Bare Earth
The journey from raw data acquisition to a polished, actionable Digital Terrain Model is a complex computational process. The most critical and challenging phase of this process is known as "bare-earth extraction" or "ground filtering." When an airborne LiDAR sensor captures data over a city, the resulting raw point cloud contains millions of points bouncing off roofs, cars, powerlines, and tree canopies. To create a DTM, all of these non-ground points must be identified, classified, and removed.
Ground Filtering Algorithms
GIS analysts and specialized software use sophisticated mathematical algorithms to classify raw point clouds. The most common approach is the Morphological Filter. This algorithm operates by laying a virtual, flexible mathematical grid over the point cloud. It essentially "sinks" the grid to the lowest points in a given local area, assuming that the lowest points represent the actual ground. It then compares adjacent points; if the angle and elevation jump between two points exceed a specified threshold (e.g., a sudden vertical jump of 5 meters), the algorithm assumes the higher point is a building or a tree and removes it from the ground dataset.
Other methods, such as the Progressive TIN Densification (PTD) algorithm, start by creating a rough, sparse TIN using only the absolute lowest points in a large neighborhood. The algorithm then iteratively evaluates the remaining unclassified points, adding them to the TIN only if they fit within tight geometric constraints relative to the existing triangles. These algorithms are highly effective, but they are not flawless. Thick, low-lying vegetation or complex architectural structures with multiple overhangs can confuse the filters, requiring manual review and editing by GIS technicians.
Interpolation Techniques
Once the non-ground points have been stripped away, the analyst is left with a bare-earth point cloud. But removing buildings and trees leaves literal "holes" or data gaps in the terrain model. To create a continuous raster grid, these gaps must be filled using spatial interpolation.
Interpolation is the mathematical process of estimating the unknown elevation values of empty pixels based on the known elevation values of surrounding points. Several algorithms exist for this purpose, each with distinct advantages:
- Inverse Distance Weighting (IDW): This deterministic method assumes that points closer to the gap have a greater influence on its elevation than points farther away. It is simple and effective but can create "bullseye" artifacts around isolated data points.
- Spline: Spline interpolation fits a smooth mathematical surface through the known points, much like bending a flexible sheet of rubber. It is excellent for generating smooth, visually pleasing terrain models like rolling hills, but it can create artificial peaks and valleys in rugged, chaotic landscapes.
- Kriging: A highly advanced geostatistical method that not only considers the distance between points but also the overall spatial variance and autocorrelation of the terrain. Kriging provides the most statistically accurate interpolation and generates a measure of uncertainty for the estimated values, making it the preferred choice for rigorous scientific analysis.
Applications of Digital Terrain Models
The ability to accurately digitize and analyze the bare-earth surface has revolutionized countless industries. Digital Terrain Models are not just passive maps; they are active, dynamic datasets used to solve critical spatial problems.
1. Hydrology and Flood Modeling
Perhaps the most vital application of DTMs lies in water resource management. Because water strictly follows the laws of gravity, understanding the exact slope and depression of the terrain is essential. Using a DTM, hydrologists can computationally determine the direction of water flow, delineate watershed boundaries, and map out complex stream networks. In disaster management, highly accurate LiDAR-derived DTMs are fed into hydrodynamic models to simulate storm surges, river overflows, and sea-level rise. By identifying which topographic depressions will fill with water first, emergency planners can delineate flood risk zones and design effective evacuation routes.
2. Civil Engineering and Infrastructure Design
In civil engineering, moving earth (cut and fill) is one of the most expensive components of construction. Engineers rely heavily on TIN-based DTMs to calculate precise earthwork volumes. When designing a new highway or railway, software automatically computes exactly how much soil must be excavated from a hill (cut) and how much dirt is needed to fill a valley (fill) to maintain the required grade. A highly accurate DTM ensures these calculations are exact, saving millions of dollars in material and transportation costs.
3. Precision Agriculture and Forestry
In precision agriculture, micro-variations in terrain dictate soil moisture retention and erosion vulnerability. Farmers use DTMs to design precision irrigation systems, ensuring water flows optimally across the fields. Also, slope and aspect derivatives generated from the DTM help determine which areas of a farm receive the most sunlight, guiding decisions on where to plant specific crop varieties.
In forestry, the DTM is used in conjunction with the DSM. By subtracting the bare-earth DTM from the top-canopy DSM, foresters generate a Canopy Height Model (CHM). This model reveals the exact height of every individual tree in a forest, allowing analysts to estimate timber volume, assess forest health, and monitor deforestation.
4. Military and Defense Operations
Terrain has historically dictated the outcome of military engagements. Modern armed forces use high-resolution DTMs to perform advanced viewshed and line-of-sight analyses. By determining exactly what geographic areas are visible from a specific vantage point, military planners can identify blind spots, optimize radar and communications placements, and simulate complex battlefield scenarios in synthetic 3D training environments.
Challenges, Quality Assessment, and Future Trends
Despite massive technological leaps, generating and utilizing Digital Terrain Models is not without challenges. The primary obstacle remains the complexity of bare-earth extraction in dense, tropical rainforest environments, where even the most advanced LiDAR pulses struggle to penetrate the canopy. Also, the sheer volume of data generated by modern sensors poses significant storage and processing hurdles. A high-resolution point cloud for a single county can easily exceed hundreds of gigabytes, requiring specialized cloud-based processing pipelines to render the DTM efficiently.
Assessing DTM Quality
A DTM is only as useful as its accuracy. Quality assessment typically involves comparing the generated DTM against independent, highly accurate Ground Control Points (GCPs) collected via traditional GPS surveys. Analysts calculate the Root Mean Square Error (RMSE) to quantify the vertical deviation of the DTM. Beyond absolute accuracy, GIS professionals must also assess relative accuracy (the consistency of the terrain representation) and be vigilant against interpolation artifacts, such as artificial ridges or "dimples" created by improper data filtering.
Machine Learning in Terrain Modeling
The future of DTM generation is inextricably linked to Artificial Intelligence and Machine Learning (ML). Deep learning models, specifically Convolutional Neural Networks (CNNs), are being trained to automatically classify point clouds with human-level accuracy. Instead of relying on geometric rules (like the Morphological Filter), these AI models "learn" what a building, a tree, and bare ground look like across millions of diverse geographic samples. This approach is dramatically reducing the need for manual point cloud editing, exponentially speeding up the DTM generation pipeline.
Also, AI is being used to computationally super-resolve low-resolution DTMs. By feeding a 30-meter radar DEM into a Generative Adversarial Network (GAN), researchers can predict and generate high-frequency topographic details, effectively synthesizing a higher-resolution terrain model.
Conclusion
The Digital Terrain Model is arguably one of the most foundational datasets in the entire geospatial ecosystem. From the early days of manual topographic mapping to the contemporary era of AI-driven, planetary-scale point clouds, our ability to accurately map and model the Earth's bare surface has completely transformed how we interact with the physical world. Whether it's predicting the path of a catastrophic flood, guiding a precision agricultural drone, or engineering the highways of tomorrow, the DTM serves as the digital canvas upon which modern spatial science is painted.
As sensor technologies become cheaper, more ubiquitous, and more accurate, and as artificial intelligence streamlines the extraction of the bare earth, high-resolution DTMs will become increasingly accessible. Understanding the nuances of DTMs, how they differ from DSMs, the technologies used to capture them, and the algorithms used to process them, is essential for any GIS professional looking to unlock the full potential of spatial analysis.
Frequently Asked Questions
What is the main difference between a DTM and a DEM?
A Digital Elevation Model (DEM) is a generic term for any digital representation of elevation. A Digital Terrain Model (DTM) is a specific type of DEM that represents only the bare-earth surface, with all trees, buildings, and infrastructure removed. In some regions, like the US, DEM implies a bare-earth model, making it synonymous with DTM, but generally, DTM is the more precise term for the bare ground.
Can a DTM be created using a drone?
Yes. Drones equipped with LiDAR sensors can penetrate vegetation to capture highly accurate bare-earth points for DTM generation. Drones using standard optical cameras (photogrammetry) can also create DTMs, but their accuracy decreases in heavily vegetated areas since cameras cannot see through the canopy to the ground.
Why do civil engineers prefer TINs over Raster grids?
Triangulated Irregular Networks (TINs) are preferred in civil engineering because they can incorporate breaklines, sharp, defined edges like retaining walls or curbs. Raster grids smooth these sharp edges across uniform pixels, leading to less accurate earthwork volume calculations.
How to create digital terrain model?
A Digital Terrain Model is typically created by first collecting elevation data using technologies like LiDAR, photogrammetry, or traditional land surveying. Once a dense 3D point cloud is generated, specialized algorithms filter out non-ground points such as buildings and vegetation. The remaining bare-earth points are then interpolated into a continuous raster grid or a Triangulated Irregular Network (TIN) to form the final DTM.
What is digital terrain model?
A Digital Terrain Model (DTM) is a 3D digital representation of the Earth's bare ground surface. Unlike a Digital Surface Model (DSM) which includes buildings, trees, and other surface objects, a DTM represents strictly the underlying terrain. This makes it essential for applications like flood modeling, civil engineering, and geological analysis.
