Flood Risk Assessment using Digital Elevation Models (DEM)
Table of Contents
- What is a Digital Elevation Model (DEM)? Defining the Terminology
- Data Acquisition Technologies for High-Fidelity DEMs
- Airborne Light Detection and Ranging (LiDAR)
- Photogrammetry (UAVs and Satellite Imagery)
- Synthetic Aperture Radar (SAR) and Interferometric SAR (InSAR)
- Sonar and Bathymetric LiDAR for Submerged Terrain
- The Vital function of Digital Elevation Models for Flood Risk Assessment
- Hydrological Modeling and Automated Catchment Delineation
- Hydraulic Modeling Approaches (1D, 2D, and 1D/2D Coupled)
- Flood Inundation Mapping and Socioeconomic Vulnerability Analysis
- Key DEM Characteristics Influencing Flood Modeling Accuracy
- Spatial Resolution (Grid Cell Size)
- Vertical Accuracy and Error Metrics
- Hydrological Conditioning (Hydro-Enforcement)
- The Rigorous Workflow: Integrating DEMs into Flood Risk Assessment
- 1. Data Acquisition, Projection, and Quality Assurance
- 2. Advanced Pre-processing and Geomorphological Hydro-Conditioning
- 3. Hydraulic Model Selection and Complex Mesh Generation
- 4. Rigorous Calibration and Validation Protocols
- 5. Scenario Generation, Simulation, and Hazard Mapping
- Critical Challenges and Limitations in DEM-Based Flood Modeling
- The "Bare-Earth" Fallacy in Highly Dense Urban Environments
- Severe Computational Bottlenecks and Hardware Limits
- Inherent Uncertainty and Mathematical Error Propagation
- Advanced Applications and Trends in Topographic Modeling
- Machine Learning and AI-Driven DEM Super-Resolution
- The Shift Toward Dynamic and Real-Time Morphodynamic DEMs
- Next-Generation, High-Accuracy Global Satellite Datasets
- Frequently Asked Questions (FAQs)
- Why is a DTM specifically preferred over a DSM for riverine flood modeling?
- Exactly how does the spatial resolution of a DEM affect the final accuracy of a flood map?
- What exactly is hydro-conditioning in the specific context of working with DEMs?
- Can consumer or commercial drone (UAV) data be effectively used to create digital elevation models for flood risk assessment?
- What is the fundamental difference between hydrologic and hydraulic modeling when using DEMs?
- Conclusion
- Frequently Asked Questions
rsandgis.me
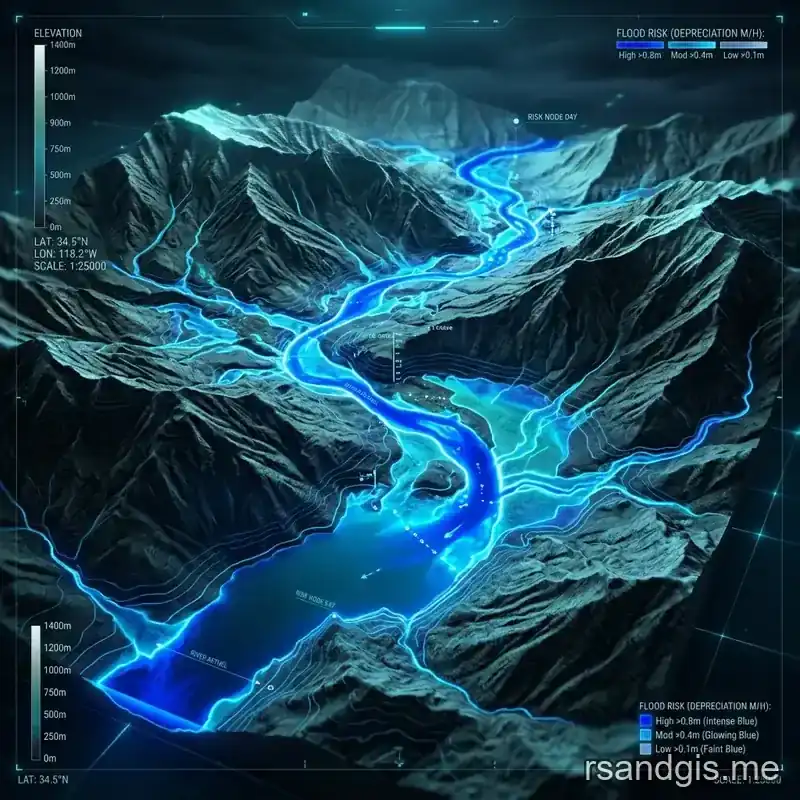
In an era characterized by intensifying climate change, increasingly erratic weather patterns, and rapid, often unregulated urbanization, precise environmental modeling has never been more critical. At the very heart of accurate hydrological and hydraulic simulations are digital elevation models for flood risk assessment. These sophisticated geospatial datasets provide the foundational topographic framework required to mathematically predict, accurately map, and strategically mitigate the devastating impacts of catastrophic flood events. From delineating massive river catchments spanning thousands of square kilometers to simulating complex two-dimensional urban inundation scenarios block by block, Digital Elevation Models (DEMs) serve as the indispensable bedrock upon which resilient infrastructure, zoning laws, and effective emergency response strategies are built.
Understanding the deep intricacies of digital elevation models for flood risk assessment is an absolute prerequisite for modern hydrologists, Geographic Information Systems (GIS) professionals, civil and environmental engineers, and municipal urban planners. A DEM is not merely a static digital picture or a visually pleasing 3D rendering of the terrain; it is a meticulously structured, mathematically rigorous representation of the Earth's continuous surface. In its ideal form for riverine flood modeling, it is entirely devoid of vegetation and man-made structures. The mathematical precision of these models directly governs the reliability of the resulting flood hazard maps. A vertical error of mere centimeters in a DEM can mean the difference between correctly identifying a safe, elevated evacuation zone and catastrophically miscalculating the vulnerability of a densely populated, low-lying neighborhood, leading to misallocated resources and heightened risk to human life.
What is a Digital Elevation Model (DEM)? Defining the Terminology
Before diving into their rigorous application in hydrologic modeling, it is essential to establish precise geospatial terminology. In the broader earth sciences, a Digital Elevation Model (DEM) is a generic, encompassing term for any digital representation of a topographic surface. But within the highly specific context of flood modeling, critical distinctions must be made between different types of elevation datasets to avoid fundamental modeling errors:
- Digital Terrain Model (DTM): A DTM represents the "bare-earth" surface. It has been mathematically filtered and entirely stripped of all natural and artificial above-ground features, such as vegetation canopies, individual trees, residential buildings, skyscrapers, and bridges. For the vast majority of riverine, coastal, and broad-scale flood modeling, a highly accurate, hydro-conditioned DTM is strictly required. This ensures that simulated water flows naturally across the terrain according to gravity, without being artificially blocked by a forest canopy or non-solid structures like overpasses.
- Digital Surface Model (DSM): Conversely, a DSM captures the highest elevation points of the landscape, effectively representing the "first return" of a sensor. This includes the tops of buildings, the uppermost canopy of forests, and other elevated infrastructure. While a bare-earth DTM is generally preferred for large-scale floodplain mapping, a DSM (or a highly modified "hydro-flattened" version) can be exceptionally useful, and sometimes strictly necessary, in urban flood modeling (specifically pluvial flooding caused by extreme rainfall overwhelming drainage systems). In dense urban canyons, buildings act as massive, solid concrete barriers that physically block and redirect overland water flow, making their inclusion in the topographic model critical for accurate urban hydrodynamic simulations.
When engineering professionals and hydrologists discuss digital elevation models for flood risk assessment, they are typically referring to high-resolution DTMs that have been specifically generated, rigorously cleaned, and logically conditioned for hydrological continuity.
Data Acquisition Technologies for High-Fidelity DEMs
The predictive quality and reliability of any hydraulic flood model are intrinsically and unavoidably linked to the underlying data acquisition method used to capture the topography. Several advanced remote sensing technologies are employed to generate high-fidelity DEMs, each offering distinct advantages and tradeoffs regarding spatial resolution, vertical accuracy, acquisition speed, and financial cost.
Airborne Light Detection and Ranging (LiDAR)
Airborne LiDAR indisputably represents the absolute gold standard for generating digital elevation models for flood risk assessment. LiDAR sensors, typically mounted on fixed-wing aircraft or helicopters, emit rapid, high-frequency laser pulses (often millions of pulses per second) toward the ground and precisely measure the time it takes for the reflected light to return to the sensor. Crucially for flood modeling, laser pulses can penetrate through small gaps in dense forest canopies. A single laser pulse can yield multiple "returns." The first return hits the top of the tree, intermediate returns hit branches, and the final return often reaches the true ground surface. This capability allows for the highly accurate extraction of a bare-earth DTM even in heavily vegetated, impenetrable riparian floodplains. Modern LiDAR-derived DEMs typically boast spatial resolutions of 1 meter or even 0.5 meters, with vertical accuracies often falling within an astonishing 10 to 15 centimeters (Root Mean Square Error). This unparalleled level of precision is absolutely imperative for accurately mapping subtle, yet hydraulically critical topographic features like levees, floodwalls, berms, and micro-drainage channels that dictate water movement.
Photogrammetry (UAVs and Satellite Imagery)
Advancements in computer vision algorithms, specifically Structure-from-Motion (SfM), have revolutionized photogrammetric DEM generation. Unmanned Aerial Vehicles (UAVs) or drones can capture hundreds or thousands of highly overlapping, high-resolution aerial images. SfM software then processes this imagery, identifying common tie-points across multiple photos to construct dense 3D point clouds and subsequent continuous DEMs. While UAV photogrammetry is exceptionally cost-effective for localized studies and provides astonishing spatial resolution (down to a few centimeters per pixel), it possesses a significant limitation: it fundamentally relies on passive optical imagery. It cannot "see through" vegetation. Therefore, it naturally generates a DSM rather than a bare-earth DTM. As a result, its use in vegetated river corridors requires aggressive, complex filtering algorithms that can inadvertently remove actual terrain features or introduce substantial vertical uncertainty.
Synthetic Aperture Radar (SAR) and Interferometric SAR (InSAR)
Satellite-based SAR operates by actively transmitting microwave pulses toward the Earth's surface and recording the backscattered signal. Because microwaves operate at wavelengths that easily penetrate clouds, smoke, and are relatively insensitive to atmospheric conditions, SAR can successfully acquire data day or night, regardless of extreme weather. Interferometric SAR (InSAR) leverages the phase difference between two SAR images acquired from slightly different orbital positions to calculate surface elevation mathematically. Global DEM datasets, such as the seminal Shuttle Radar Topography Mission (SRTM) and the more recent Copernicus DEM, rely heavily on these radar technologies. While their spatial resolution (typically ranging from 10 to 30 meters) is notably coarser than airborne LiDAR, radar-derived DEMs are an invaluable resource for large-scale, basin-wide flood risk assessments, particularly in remote regions, developing nations, or areas where high-resolution airborne data is completely unavailable or financially prohibitively expensive.
Sonar and Bathymetric LiDAR for Submerged Terrain
A comprehensive flood risk assessment is fundamentally incomplete without a precise understanding of the volumetric geometry of the primary river channel itself. Standard near-infrared topographic LiDAR lasers reflect off the water's surface and cannot penetrate the water column. Therefore, specialized technologies are required to map the submerged topography, known as bathymetry. Green-wavelength bathymetric LiDAR systems can penetrate clear, shallow water columns to map riverbeds. For deeper, turbid rivers, boat-mounted acoustic multibeam sonar systems are required. The highly complex process of mathematically merging terrestrial LiDAR DEMs with acoustic bathymetric data creates a continuous, seamless "topo-bathymetric" surface. This seamless surface is the absolute prerequisite for accurate 1D and 2D hydraulic modeling of riverine systems, as the channel volume dictates how much water can be conveyed before spilling over the banks.
The Vital function of Digital Elevation Models for Flood Risk Assessment
The seamless integration of digital elevation models for flood risk assessment forms the indispensable core of modern hydrologic and hydraulic engineering practice. The DEM strictly dictates the physics of the model, how water accumulates in the watershed, where it geographically flows, how fast it travels over varying slopes, and ultimately, exactly which geographical areas it inundates during an extreme weather event.
Hydrological Modeling and Automated Catchment Delineation
The very first analytical step in any comprehensive flood assessment is understanding hydrologic routing: determining exactly how much water will reach a specific geographic point (a node) in a river network after a specified rainfall event. Hydrological models (like HEC-HMS or SWAT) rely entirely on DEMs to automate the massive mathematical extraction of watershed parameters. GIS software uses the DEM grid to calculate flow direction matrices, flow accumulation grids, and to automatically delineate accurate drainage basins, sub-basins, and stream networks. The slope of the terrain, mathematically derived directly from the spatial derivative of the DEM, is a primary driving variable in calculating the "time of concentration", the time it takes for a single drop of water to travel overland from the most hydraulically distant point in the watershed to the catchment outlet. Utilizing flawed, coarse, or inaccurate DEMs inevitably leads to incorrectly drawn catchment boundaries and skewed slope calculations, resulting in the catastrophic overestimation or dangerous underestimation of peak discharge rates.
Hydraulic Modeling Approaches (1D, 2D, and 1D/2D Coupled)
Once the hydrological model mathematically provides the peak discharge (the volumetric flow rate, typically in cubic meters per second), complex hydraulic models are deployed to determine the resulting water surface elevation and flow velocities distributed dynamically across the floodplain.
- 1D Hydraulic Modeling: Traditionally, 1D models (such as legacy versions of HEC-RAS or MIKE 11) extract discrete, widely spaced cross-sectional cut lines from the DEM. Water flow is simulated purely in the longitudinal direction flowing downstream along the primary channel. While highly computationally efficient and useful for straightforward, confined river reaches, 1D models struggle significantly to accurately represent complex, multi-directional overbank flow in wide, flat coastal plains or highly braided river systems.
- 2D Hydrodynamic Modeling: Modern, state-of-the-art flood risk assessment relies overwhelmingly on fully dynamic 2D hydrodynamic modeling. In this sophisticated approach, the entire continuous DEM is converted into a vast computational mesh consisting of thousands or millions of individual grid cells. The model mathematically solves the complex shallow water equations (Saint-Venant equations) across this entire grid, allowing simulated water to flow simultaneously and dynamically in both the X and Y horizontal directions. High-resolution digital elevation models for flood risk assessment are absolutely essential here, as the hydrodynamic solver explicitly uses the precise elevation of each individual grid cell to accurately route the water around physical obstacles, through intricate complex urban geometry, and across varying topographic gradients.
- 1D/2D Coupled Modeling: A highly efficient hybrid approach involves coupling a 1D model for the deep, main river channel with a 2D mesh for the adjacent, wide overbank floodplains. The DEM is used to strictly define the lateral structures (like levees or high banks) that mathematically connect the 1D channel to the 2D floodplain. When the 1D channel capacity is exceeded, water mathematically spills over the lateral structure derived from the DEM and spreads dynamically across the 2D mesh.
Flood Inundation Mapping and Socioeconomic Vulnerability Analysis
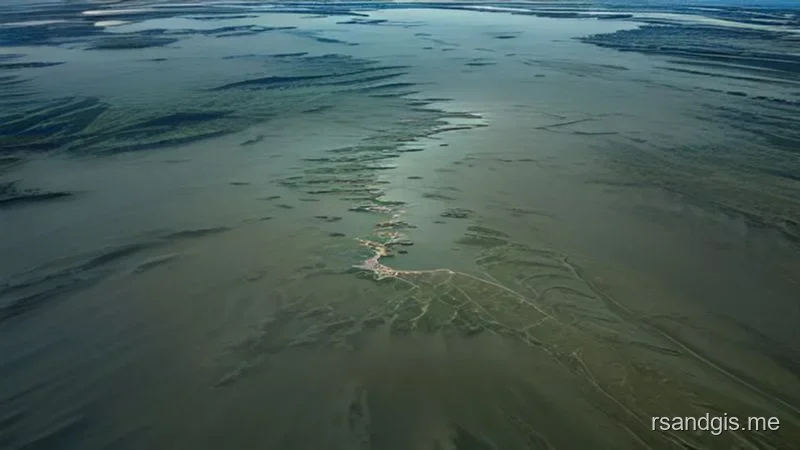
The ultimate, actionable output resulting from the integration of digital elevation models for flood risk assessment is the production of the final flood inundation map. By mathematically intersecting the simulated, dynamic water surface elevations generated by the hydraulic model with the underlying, highly accurate bare-earth DEM, engineers generate detailed depth grids. These high-resolution maps vividly visualize the exact spatial extent, specific depth, and localized flow velocity of floodwaters under various hypothetical design scenarios (e.g., simulating a 1-in-100 year or 1-in-500 year return period storm event). Urban planners and emergency managers then systematically overlay these critical depth grids with demographic data, property parcel boundaries, and critical infrastructure locations (hospitals, power plants, evacuation routes) to conduct rigorous, quantitative economic damage assessments and critical life-safety evaluations.
Key DEM Characteristics Influencing Flood Modeling Accuracy
It is vital to understand that not all DEMs are created equal. When actively selecting digital elevation models for flood risk assessment, hydraulic modelers must critically evaluate several crucial spatial parameters to ensure the data is fit-for-purpose.
Spatial Resolution (Grid Cell Size)
Spatial resolution refers to the exact geographic area physically represented by a single pixel or grid cell within the DEM raster. A 1-meter resolution DEM dictates that each pixel represents a distinct 1m x 1m square of physical terrain. Higher spatial resolution effectively allows the hydraulic model to "see" and mathematically interact with intricate flow pathways, small retaining walls, narrow drainage ditches, and slight road cambers that significantly influence local flood propagation. But ultra-high resolution models drastically and exponentially increase the computational overhead required to solve the hydrodynamic equations. A common, highly effective engineering practice to mitigate this is utilizing a flexible, unstructured "sub-grid" mesh approach. In this advanced method, a somewhat coarser computational grid is used to speed up processing, but the critical volume-elevation relationships (hypsometry) for each cell face and cell volume are derived precisely from the underlying high-resolution DEM.
Vertical Accuracy and Error Metrics
Vertical accuracy is arguably the single most critical parameter in flood modeling, particularly in flat, low-gradient coastal plains or massive deltas where a mere 10-centimeter vertical discrepancy in the DEM can drastically alter the predicted inundation boundary by hundreds of meters or even kilometers laterally. Modelers must rigorously examine the official metadata of the DEM to deeply understand its Root Mean Square Error (RMSE) in the vertical dimension compared to surveyed ground control points. High-quality airborne LiDAR DEMs generally offer stellar vertical accuracies below 15cm RMSE, whereas freely available satellite-derived DEMs might suffer from vertical errors of several meters, rendering them unsuitable for localized micro-scale modeling.
Hydrological Conditioning (Hydro-Enforcement)
Raw DEMs, even phenomenally accurate, high-quality datasets derived from modern LiDAR, are rarely, if ever, ready for immediate, plug-and-play hydraulic modeling. They inherently contain artificial topographic impediments due to the nature of bare-earth filtering.
For instance, a major elevated highway bridge spanning a river will appear in a raw bare-earth DTM as a massive, solid earthen dam completely blocking the river channel (because the bridge deck itself is stripped away by the algorithm, but the solid earth abutments remain). If this is not manually corrected, a hydraulic model will mathematically and artificially back up water behind this non-existent "dam," completely ruining the simulation.
Hydrological conditioning, often termed hydro-enforcement, is the laborious, highly skilled GIS process of manually or semi-automatically editing the DEM raster to ensure continuous, logical water flow. This critical process primarily involves:
- Digital Breaching: Mathematically cutting notches or channels through artificial DEM blockages like bridges, culverts, and raised overpasses to allow simulated water to pass through the structure freely, as it would in reality.
- Filling Sinks and Depressions: Using specialized GIS algorithms to locate and artificially "fill" small, artificial depressions (data artifacts or noise) that would erroneously trap and permanently store water during a hydrologic simulation, preventing it from routing downstream.
- Stream Burning: The process of mathematically forcing a known, highly accurate, surveyed vector stream network into a coarser DEM raster by artificially lowering the elevation of the pixels along the vector line. This ensures the hydrologic model strictly routes water exactly where the actual physical channel exists, overriding minor DEM inaccuracies.
The Rigorous Workflow: Integrating DEMs into Flood Risk Assessment
The highly technical, practical application of digital elevation models for flood risk assessment follows a rigorous, multi-step engineering workflow specifically designed to systematically minimize error propagation and maximize the predictive reliability of the final flood maps.
1. Data Acquisition, Projection, and Quality Assurance
The meticulous process begins with actively acquiring the most topographically suitable DEM for the specific project scope and budget. Modelers must rigorously verify the spatial reference system, map projection, and vertical datum (e.g., matching the data to NAVD88 in the United States or AHD in Australia). They must deeply assess the metadata for accuracy reports. Quality Assurance and Quality Control (QA/QC) processes involve systematically visually inspecting the DEM for data holidays (missing data voids), edge-matching discrepancies if mosaicking multiple separate DEM tiles together, and assessing the pervasive presence of unremoved artifacts like leftover buildings, dense vegetation patches, or processing anomalies.
2. Advanced Pre-processing and Geomorphological Hydro-Conditioning
As previously detailed, the raw DEM must be rigorously conditioned. This crucial step often involves using advanced GIS software suites like ArcGIS Spatial Analyst, QGIS, SAGA GIS, or the highly specialized open-source WhiteboxTools. This phase involves mathematically integrating high-resolution bathymetric survey data into the terrestrial DEM to create a continuous, seamless topological surface. Buried culverts and spanning bridges are digitally "breached." Also, topographic breaklines, linear vector features representing distinct elevation changes like ridge tops, road crowns, or levee crests, are strictly enforced into the DEM to ensure these critical, flow-controlling structures are precisely captured and represented in the subsequent computational mesh generation process.
3. Hydraulic Model Selection and Complex Mesh Generation
Depending upon the exact study's geomorphological complexity and required output, specialized engineers select an appropriate hydraulic modeling software suite (industry standards include HEC-RAS, TUFLOW, XPSWMM, InfoWorks ICM, or MIKE FLOOD). The conditioned DEM is imported into the modeling environment, and a vast computational mesh is carefully draped over the topography. In fully dynamic 2D modeling, mesh alignment is highly critical; computational cell faces must physically align perfectly with the topographic breaklines extracted directly from the DEM to strictly prevent the artificial computational "leaking" or "bleeding" of simulated water across critical boundaries like floodwalls or levees.
4. Rigorous Calibration and Validation Protocols
A hydrodynamic flood model is fundamentally only as scientifically valid as its empirical calibration. Modelers meticulously simulate well-documented historical flood events and systematically compare the model's predicted peak water surface elevations, flow velocities, and total inundation extents against observed, real-world data (such as surveyed high-water marks on buildings, historical river gauge records, and analyzed satellite imagery captured during the peak of the flood). If the model significantly deviates from reality, parameters such as channel and floodplain surface roughness (represented by Manning's 'n' values) are carefully iteratively adjusted. Crucially, calibration often reveals fundamental, underlying structural errors in the initial DEM that require the modeler to return to the pre-processing phase to fix the topography.
5. Scenario Generation, Simulation, and Hazard Mapping
Once successfully calibrated and scientifically validated, the model is cleared to run various hypothetical design storms, theoretical rainfall events possessing specific, calculated statistical probabilities, such as the 1% annual exceedance probability (AEP) flood (commonly, though somewhat misleadingly, known as the 100-year flood event). The massive output datasets resulting from these runs are processed to generate the final, actionable flood hazard maps, which clearly display precise water depth, flow velocity, and an overall hazard rating index (often calculated by mathematically multiplying depth by velocity to determine the danger to pedestrians and vehicles).
Critical Challenges and Limitations in DEM-Based Flood Modeling
Despite massive technological leaps in remote sensing and cloud computing, the utilization of digital elevation models for flood risk assessment is definitely not without its significant technical challenges and inherent limitations.
The "Bare-Earth" Fallacy in Highly Dense Urban Environments
Creating a truly accurate, artifact-free bare-earth DTM in highly dense urban areas is notoriously difficult, even with dense LiDAR. The sophisticated classification algorithms used to digitally strip away buildings and infrastructure from the massive LiDAR point clouds often struggle in tightly packed, complex metropolitan neighborhoods. If a massive building footprint is not entirely successfully removed, or if the hidden terrain underneath the structure is incorrectly mathematically interpolated, it leaves behind artificial "mounds" or anomalies that incorrectly divert simulated flow paths in 2D urban pluvial flood models. Conversely, utilizing a purely flattened DTM in an urban area completely ignores the physical reality that solid concrete buildings physically block, tunnel, and redirect extreme water flows.
Severe Computational Bottlenecks and Hardware Limits
The relentless industry push for utilizing hyper-resolution digital elevation models for flood risk assessment demands absolutely massive, sometimes prohibitive, computational resources. Running a fully dynamic, unsteady-flow 2D simulation over a continuous 1-meter resolution DEM for a massive river basin spanning hundreds of miles can easily take days or even weeks of continuous processing on standard engineering workstations. Continually finding the optimal, pragmatic balance between necessary topographic resolution and reasonable computational efficiency remains an ongoing, daily challenge for modelers, rapidly driving the industry-wide adoption of highly parallelized cloud computing infrastructure and advanced GPU-accelerated hydrodynamic solvers.
Inherent Uncertainty and Mathematical Error Propagation
It is a fundamental law of geospatial analysis that every DEM contains inherent, unavoidable uncertainty due to hardware sensor limitations, sub-optimal atmospheric conditions during aerial data capture, GPS positioning errors, and mathematical interpolation artifacts. This baseline topographic uncertainty inextricably propagates entirely through both the hydrological and hydraulic models. Advanced, state-of-the-art flood risk assessments increasingly employ probabilistic or complex ensemble modeling techniques, systematically running hundreds of simulations across a statistically generated range of differing DEM realizations to quantitatively determine the statistical uncertainty bounds and confidence intervals of the final published flood maps.
Advanced Applications and Trends in Topographic Modeling
The scientific landscape of digital elevation models for flood risk assessment is rapidly and continually evolving, primarily driven by massive innovations in artificial intelligence, machine learning, and next-generation space-borne remote sensing platforms.
Machine Learning and AI-Driven DEM Super-Resolution
Geospatial researchers are increasingly and successfully utilizing advanced deep learning architectures, particularly sophisticated Generative Adversarial Networks (GANs) and Convolutional Neural Networks (CNNs), to artificially enhance the spatial resolution of coarse, freely available global DEM datasets. By rigorously training AI models on paired datasets of coarse satellite DEMs and high-resolution airborne LiDAR data, the neural networks can "learn" to intelligently "upscale" coarse imagery, mathematically inferring highly realistic sub-grid topographic details like channels and ridges. This breakthrough technology has massive, life-saving implications for conducting accurate flood modeling in developing nations that currently lack the financial budget required for extensive, bespoke airborne LiDAR campaigns.
The Shift Toward Dynamic and Real-Time Morphodynamic DEMs
Traditionally, in hydraulic modeling, a DEM is rigidly treated as a static, unchanging snapshot of the Earth locked in time. But river geomorphology is violently dynamic; sandy channels rapidly scour deeper and floodplains fill with sediment during massive, turbulent flood events. Cutting-edge future flood modeling workflows aim to smoothly incorporate dynamic DEMs that mathematically adapt and physically change shape during the computer simulation based on complex sediment transport physics and morphodynamic equations. This will eventually provide vastly more accurate predictions of catastrophic levee breaches, rapid bank erosion, and sudden channel avulsions during extreme events.
Next-Generation, High-Accuracy Global Satellite Datasets
The rapid proliferation of new, highly advanced satellite missions continues to steadily improve the baseline quality of global elevation data. Highly refined datasets like the Copernicus DEM (offering 30m resolution globally, and 10m in Europe), NASA's NASADEM, and the incredible ALOS World 3D (AW3D30) currently provide unparalleled, highly accurate baseline topographies for the entire planet. Also, future proposed spaceborne LiDAR missions (similar in concept to ICESat-2 but specifically optimized for dense terrestrial topography mapping) promise to eventually deliver near-airborne-LiDAR quality DTMs on a truly global scale, ultimately democratizing access to high-quality digital elevation models for flood risk assessment worldwide.
Frequently Asked Questions (FAQs)
Why is a DTM specifically preferred over a DSM for riverine flood modeling?
A Digital Terrain Model (DTM) mathematically represents the bare earth, completely devoid of structures, whereas a Digital Surface Model (DSM) includes the heights of trees, forests, and buildings. In standard riverine flood modeling, a DTM is absolutely strictly necessary because floodwater physically flows underneath forest canopies, through dense brush, and eventually around certain raised structures. If a DSM were erroneously used, a dense forest would mathematically appear to the hydraulic model as a solid, impenetrable block of high elevation terrain, artificially and incorrectly preventing the simulated water from flowing naturally into the floodplain.
Exactly how does the spatial resolution of a DEM affect the final accuracy of a flood map?
Higher spatial resolution directly allows the hydrodynamic model to "see" and interact mathematically with much smaller topographic features that dictate water movement, such as small agricultural drainage ditches, raised road crowns, retaining walls, and localized topographic depressions. A coarse DEM (for example, a 30-meter satellite grid) will mathematically average out and flatten these critical features, almost always leading to a wider, shallower, and significantly less accurate representation of the true flood extent. But finer resolution exponentially increases the required computational time.
What exactly is hydro-conditioning in the specific context of working with DEMs?
Hydro-conditioning is the specialized, manual, or semi-automated GIS process of meticulously modifying a raw DEM so that it correctly and logically routes simulated water in a hydraulic model without artificial impedance. The most critical and common task is "breaching" bridges and road culverts. In a standard raw bare-earth DEM, a solid road embankment passing over a river looks mathematically like a solid dam because the bridge deck has been removed, but the raised earth remains. Hydro-conditioning digitally cuts a topographic notch directly through this embankment to explicitly allow simulated water to pass down the river channel uninterrupted.
Can consumer or commercial drone (UAV) data be effectively used to create digital elevation models for flood risk assessment?
Yes, drones equipped with either high-resolution optical cameras (utilizing advanced photogrammetry) or lightweight, miniaturized LiDAR sensors are excellent tools for creating highly accurate, localized DEMs. Drone LiDAR is particularly effective for highly detailed, small-scale mapping of river corridors because its laser pulses can penetrate through riparian vegetation to find the ground. Drone photogrammetry is significantly cheaper but severely struggles to generate true, reliable bare-earth models in heavily vegetated areas, limiting its use to bare ground or urban environments.
What is the fundamental difference between hydrologic and hydraulic modeling when using DEMs?
Hydrologic modeling utilizes a DEM primarily to determine how much water is generated from a specific rainfall event over a massive catchment basin. It uses the DEM topography to calculate slope, flow direction, and flow accumulation to estimate the final volume and peak discharge rate of runoff arriving at a specific point. Hydraulic modeling takes that calculated discharge data and uses the DEM as the physical surface to determine exactly how that specific volume of water physically moves, spreads, and interacts dynamically across the channel and floodplain, calculating precise water depths, flow velocities, and ultimate inundation extents.
Conclusion
The successful acquisition, rigorous processing, and intelligent implementation of high-quality digital elevation models for flood risk assessment undoubtedly constitute the absolutely critical cornerstone of modern hydrological science, civil engineering, and proactive disaster risk management. As raw computational power continues to increase exponentially and advanced data acquisition technologies like airborne LiDAR and high-resolution satellite SAR become progressively more affordable and globally accessible, the fidelity, reliability, and precision of our predictive flood models will only continue to improve dramatically. From the highly meticulous, manual hydro-conditioning of raw bare-earth terrain data to the rigorous empirical calibration of massive 2D hydrodynamic computational meshes, absolutely every single step in the complex flood modeling workflow relies implicitly and completely on the fundamental accuracy of the underlying DEM. By continuing to scientifically refine these critical geospatial datasets and adopting next-generation AI processing techniques, global society can successfully transition away from reactive, chaotic disaster response toward a paradigm of proactive, data-driven climate resilience, ultimately safeguarding critical infrastructure, protecting vulnerable economies, and preserving human lives against the steadily escalating global threat of catastrophic flooding.
Frequently Asked Questions
What is a Digital Elevation Model (DEM)?
A Digital Elevation Model (DEM) is a 3D computer graphics representation of terrain elevation data, representing the bare earth surface without natural or man-made features like trees and buildings.
How are DEMs used in flood risk assessment?
DEMs provide the foundational topographic data needed for hydrological modeling. By analyzing the slopes and low-lying depressions in the DEM, simulation software can accurately predict where water will flow and accumulate during heavy rainfall.
What is the difference between a DEM and a DSM?
A DEM (Digital Elevation Model) represents the bare ground surface, which is crucial for modeling water flow. A DSM (Digital Surface Model) includes the heights of all objects on the earth, including forests and buildings, which would incorrectly block simulated water flow if used for flood modeling.
