Deep Learning For Automated Building Footprint Extraction
Table of Contents
- Understanding Building Footprint Extraction
- The Evolution from Manual Digitization to Automation
- The Paradigm Shift: Why Deep Learning?
- The Role of High-Resolution Satellite Imagery
- Foundations of the Technology: Convolutional Neural Networks (CNNs)
- Key Components of CNNs
- U-Net: The Workhorse of Semantic Segmentation
- Mask R-CNN: Mastering Instance Segmentation
- Other Notable Architectures: DeepLab, FPN, and Transformers
- Data Preparation and Preprocessing Strategies
- Maximizing Robustness with Data Augmentation Techniques
- Model Training: Loss Functions and Optimizers
- Evaluation Metrics: Measuring Extraction Success
- Primary Metrics for Building Extraction
- Post-Processing: Refining Results and Vectorization
- Transformative Real-World Applications
- Challenges, Limitations, and Future Directions
- Conclusion
- Frequently Asked Questions
rsandgis.me
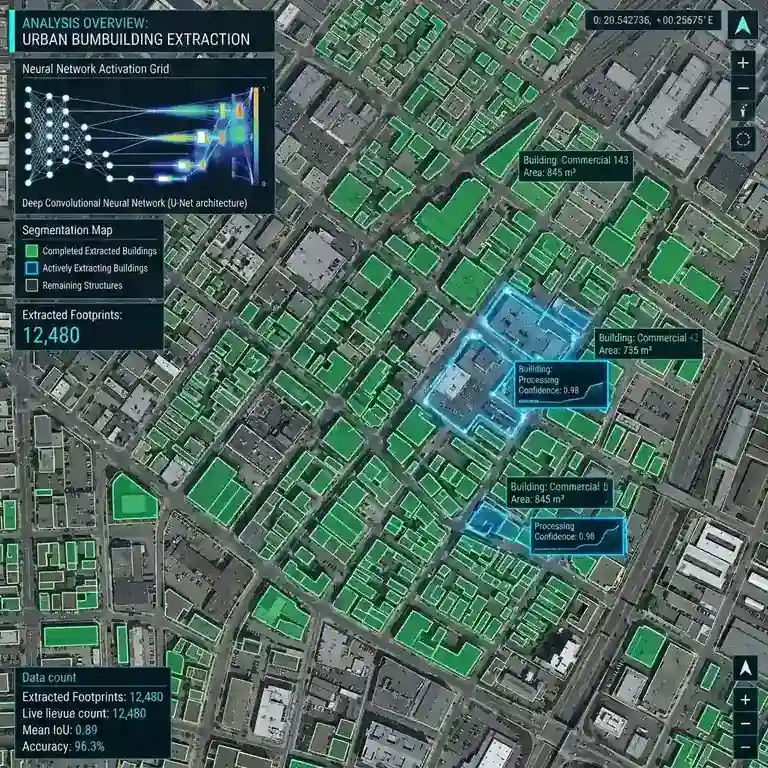
The field of remote sensing has witnessed a monumental shift in recent years, primarily driven by the integration of artificial intelligence and advanced computer vision techniques. Among the most impactful and widely discussed applications of these rapidly evolving technologies is the use of deep learning for automated building footprint extraction. By leveraging sophisticated neural network architectures, researchers, urban planners, and geographic information system (GIS) professionals can now process massive volumes of high-resolution satellite and aerial imagery with unparalleled speed, scalability, and accuracy. In the past, extracting this information required thousands of hours of manual labor, involving human annotators meticulously tracing the outlines of buildings on computer screens. Today, thanks to the exponential growth in computational power, the availability of large-scale annotated datasets, and the continuous refinement of algorithmic frameworks, machines can perform this task in a fraction of the time, often rivaling or even surpassing human precision. This comprehensive article explores the intricate methodologies, foundational concepts, and practical implementations of these technologies, diving deep into the specific frameworks, robust data preprocessing pipelines, rigorous training strategies, and transformative real-world applications that make this automated process a reality.
Understanding Building Footprint Extraction
Fundamentally, building footprint extraction refers to the process of identifying and delineating the precise two-dimensional outlines or geometric shapes of buildings as they appear from a top-down or nadir perspective in remotely sensed imagery. These footprints are typically represented as closed polygons in vector formats, such as shapefiles or GeoJSONs, which can be easily integrated into spatial databases and GIS software. The extraction process is fundamentally a computer vision problem that falls under the broader categories of image segmentation and object detection. In semantic segmentation, every pixel in an image is classified as either belonging to a building or belonging to the background. In instance segmentation, the algorithm goes a step further by not only classifying the pixels but also distinguishing individual building instances from one another, ensuring that adjacent or touching structures are recognized as separate entities. The accurate extraction of these footprints is critical because buildings are among the most fundamental components of human settlement and urban infrastructure. Having up-to-date and highly accurate building footprint data provides the foundational layer for countless geospatial analyses, from population density estimation and urban sprawl monitoring to infrastructure planning and environmental impact assessments. But the task is inherently complex due to the massive variability in building appearances worldwide, characterized by diverse architectural styles, varying roof materials, differing scales, and diverse environmental contexts.
The Evolution from Manual Digitization to Automation
To truly appreciate the value of modern automated techniques, it is essential to look back at the historical context of geographic data collection. For decades, the standard approach to generating building footprint maps was manual digitization. Highly trained geospatial analysts would painstakingly examine aerial photographs or early satellite imagery, using computer mice to click and draw polygons around every visible structure. While this method yielded high-accuracy results when performed by skilled professionals, it was agonizingly slow, incredibly expensive, and inherently non-scalable. As urban areas rapidly expanded and the frequency of satellite imagery updates increased to daily or even intra-daily cycles, the manual approach became a massive bottleneck. It was simply impossible for human operators to keep pace with the influx of new spatial data. The remote sensing community initially attempted to solve this problem using traditional, rule-based digital image processing techniques. These early automated approaches relied on handcrafted features, such as edge detection algorithms (e.g., Canny edge detector), morphological operations, color thresholding, and traditional machine learning classifiers like Support Vector Machines (SVMs) or Random Forests. While these methods represented a step forward, they often fell short in complex urban environments. Traditional algorithms struggled with the sheer heterogeneity of real-world imagery, frequently confusing buildings with other elevated or similarly colored features like shipping containers, large vehicles, paved parking lots, or rocky outcrops. They lacked the semantic understanding required to robustly separate buildings from complex backgrounds, paving the way for a major shift.

The Paradigm Shift: Why Deep Learning?
The limitations of traditional image processing techniques set the stage for the deep learning revolution in remote sensing. Deep learning, a specialized subset of machine learning inspired by the structure and function of the human brain's neural networks, introduced a fundamentally different approach to feature extraction. Instead of relying on human engineers to manually design and define the features that distinguish a building from a tree, deep learning algorithms automatically learn these optimal feature representations directly from the raw data. Through a process of training on vast datasets containing millions of diverse examples, these networks develop a profound hierarchical understanding of visual patterns. In the lower layers of a deep neural network, the model learns to identify simple features like edges, corners, and basic textures. As the data passes through the deeper layers, these simple features are combined into increasingly complex and abstract representations, eventually allowing the network to recognize complete objects, such as the distinct structural characteristics of a building's roof, regardless of its shape, color, or orientation. This capacity for hierarchical feature learning is what makes deep learning extraordinarily resilient to the massive variability found in high-resolution satellite imagery. Also, deep learning models thrive on large amounts of data; as more labeled satellite imagery becomes available, these models continually improve their accuracy and generalization capabilities, making them the indisputable state-of-the-art solution for automated building footprint extraction today.
The Role of High-Resolution Satellite Imagery
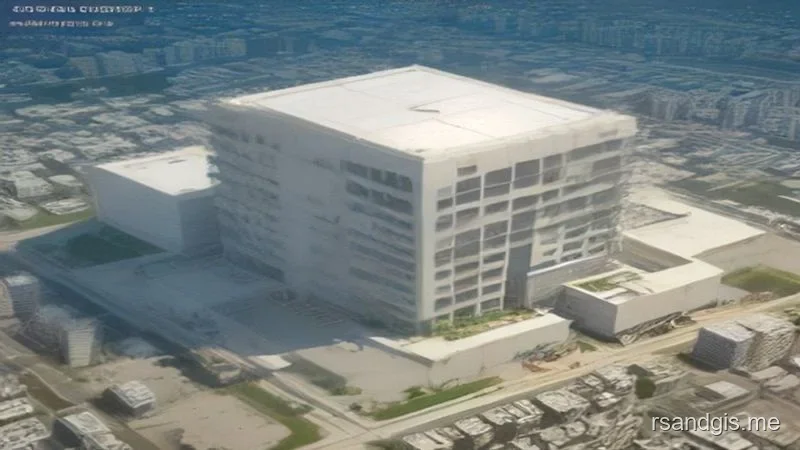
The success of deep learning in this domain is inextricably linked to the availability and quality of high-resolution satellite imagery. In the context of building extraction, spatial resolution, which refers to the physical size of the area on the ground represented by a single pixel, is of paramount importance. While medium-resolution imagery (such as Landsat at 30 meters per pixel or Sentinel-2 at 10 meters per pixel) is invaluable for regional land cover mapping, it is generally insufficient for accurately delineating individual building footprints, especially in densely populated urban areas where structures are small and closely packed. The advent of commercial satellite constellations, operated by companies like Maxar (formerly DigitalGlobe), Planet, and Airbus, has democratized access to very high-resolution (VHR) imagery, boasting spatial resolutions ranging from 30 centimeters to 1 meter per pixel. At this level of detail, the morphological characteristics of buildings, such as roof ridges, HVAC systems, chimneys, and precise boundaries, become clearly visible. This VHR imagery provides the rich, granular visual information that deep neural networks require to effectively distinguish buildings from their immediate surroundings. Also, modern satellite sensors often capture data beyond the standard red, green, and blue (RGB) optical bands. The inclusion of near-infrared (NIR) bands is particularly useful, as it allows for the calculation of vegetation indices like the Normalized Difference Vegetation Index (NDVI), which helps models easily differentiate between built structures and surrounding vegetation, thereby reducing false positives.
Foundations of the Technology: Convolutional Neural Networks (CNNs)
At the heart of almost all modern deep learning frameworks used for image analysis lies the Convolutional Neural Network (CNN). Unlike traditional fully connected neural networks, where every neuron is connected to every neuron in the subsequent layer, CNNs utilize a specialized architecture designed specifically to process grid-like data, such as images. The defining characteristic of a CNN is the convolutional layer, which employs a set of learnable filters (or kernels) that slide across the input image. As these filters move, they perform mathematical convolution operations, computing the dot product between the filter weights and the underlying image pixels.
Key Components of CNNs
- Convolutional Layers: These layers act as feature extractors. By applying various filters, they create feature maps that highlight specific spatial patterns, such as horizontal lines, vertical edges, or specific color gradients.
- Pooling Layers: Following the convolutional layers, CNNs typically employ pooling layers (such as max pooling), which downsample the spatial dimensions of the feature maps. This pooling operation reduces the computational complexity of the network by decreasing the number of parameters and provides a degree of spatial invariance.
- Fully Connected Layers: While often replaced by fully convolutional heads in modern segmentation tasks, traditional CNNs use these layers at the very end of the network architecture to make final class predictions based on the deeply extracted features.
Because these filters are shared across the entire image, CNNs possess a property known as translation invariance, meaning they can recognize a building regardless of where it is located within the image frame. Through the stacking of multiple convolutional and pooling layers, CNNs create the deep, hierarchical feature extractors necessary for advanced visual recognition tasks.
U-Net: The Workhorse of Semantic Segmentation
When discussing specific deep learning frameworks for building footprint extraction, the U-Net architecture is unequivocally the most prominent and widely adopted model in the remote sensing community. Originally developed in 2015 for biomedical image segmentation, U-Net's elegant and highly effective design made it an instant success for satellite imagery analysis. The architecture gets its name from its symmetric, U-shaped design, which consists of two main parts: an expanding path (decoder) and a contracting path (encoder). The contracting path operates much like a traditional CNN, utilizing repeated convolutional and max-pooling layers to gradually reduce the spatial dimensions of the image while simultaneously increasing the depth of the feature maps. This process captures the deep, abstract contextual information about "what" is in the image. But in the process of downsampling, fine-grained spatial information about "where" the objects are located is lost. This is where U-Net's expanding path comes into play. The decoder utilizes transposed convolutions (often referred to as upsampling) to progressively restore the spatial resolution of the feature maps back to the original image size. The true genius of the U-Net architecture, however, lies in its use of "skip connections." These connections directly link the high-resolution feature maps from the encoder to the corresponding upsampled feature maps in the decoder. By concatenating this precise localization information with the deep semantic context, U-Net is able to produce incredibly sharp, highly accurate pixel-wise segmentation masks, making it exceptionally well-suited for delineating the precise boundaries of building footprints.
Mask R-CNN: Mastering Instance Segmentation
While U-Net excels at semantic segmentation (identifying all building pixels), it fundamentally struggles to separate adjacent or overlapping buildings into distinct, individual entities. If two houses are touching, a standard U-Net will likely output a single, merged blob of building pixels. To solve this problem, researchers turn to Mask Region-Based Convolutional Neural Networks (Mask R-CNN), the gold standard framework for instance segmentation. Mask R-CNN was introduced as a logical extension of the Faster R-CNN object detection model. The architecture is a multi-stage powerhouse. First, it passes the input satellite image through a CNN backbone (often a ResNet model combined with a Feature Pyramid Network) to extract rich feature maps. Second, it utilizes a Region Proposal Network (RPN) that scans these feature maps to identify potential bounding boxes (regions of interest, or RoIs) that are likely to contain objects. Third, for each proposed bounding box, the network employs a clever operation called RoIAlign. RoIAlign precisely extracts and aligns the feature maps corresponding to each bounding box, preserving exact spatial quantization without the misalignment errors inherent in older pooling methods. Finally, these aligned features are fed into parallel network heads: one head predicts the class of the object and refines the bounding box coordinates, while a completely separate, fully convolutional head generates a pixel-perfect binary mask for the object within that specific bounding box. This multi-task learning approach allows Mask R-CNN to accurately detect individual buildings and simultaneously trace their unique footprints, making it invaluable for generating building counts and extracting separated polygons in dense urban environments.
Other Notable Architectures: DeepLab, FPN, and Transformers
While U-Net and Mask R-CNN dominate the landscape, several other deep learning architectures have proven highly effective for building footprint extraction. The DeepLab family of models, particularly DeepLabV3+, is renowned for its exceptional performance in semantic segmentation. DeepLab's signature innovation is the use of Atrous (or dilated) convolutions and Atrous Spatial Pyramid Pooling (ASPP). Atrous convolutions allow the network to expand its receptive field, the area of the input image that influences a particular neuron, without increasing the number of parameters or losing spatial resolution. This enables DeepLab to capture multi-scale contextual information, which is particularly useful for extracting buildings of vastly different sizes, from massive industrial warehouses to tiny residential sheds. Another critical architecture is the Feature Pyramid Network (FPN), which is often integrated as a backbone enhancement for other models. FPNs create a rich, multi-scale feature pyramid from a single input image size, ensuring that both high-level semantic features and low-level spatial features are available at all scales of prediction. More recently, the field has seen a surge in the application of Vision Transformers (ViTs). Originally designed for natural language processing, transformers utilize self-attention mechanisms to weigh the importance of different parts of an image relative to one another, completely bypassing traditional convolutions. Models like Swin Transformer have demonstrated state-of-the-art performance in remote sensing tasks by capturing long-range global dependencies within the imagery, offering a promising new frontier for even more accurate and robust building footprint extraction algorithms.
Data Preparation and Preprocessing Strategies
Regardless of how sophisticated the chosen deep learning framework might be, the performance of the model is ultimately dictated by the quality of the data it is trained on. In the field of satellite imagery, data preparation and preprocessing are intricate, multi-step processes that require careful attention to detail. The first major challenge is the sheer size of high-resolution satellite imagery. A single scene captured by a commercial satellite can be gigabytes in size and contain billions of pixels, making it impossible to feed directly into the limited memory (VRAM) of modern Graphics Processing Units (GPUs). To overcome this, the large satellite rasters must be systematically tiled or cropped into smaller, manageable image patches, typically sized at 256x256 or 512x512 pixels. These patches are often created with overlapping margins to ensure that buildings situated on the edges of a tile are not cut in half, which would hinder the model's ability to learn their complete shape. Simultaneously, the corresponding ground truth vector data (the known building footprints provided as polygons) must be meticulously rasterized. This involves converting the geometric polygons into binary mask images that perfectly align with the satellite patches, where a pixel value of 1 represents a building and a value of 0 represents the background. Also, the imagery must undergo rigorous normalization. Satellite images exhibit massive variations in pixel intensity ranges depending on the sensor used, the atmospheric conditions during capture, and the time of year. Normalizing the pixel values, often by scaling them to a standard range of 0 to 1 or standardizing them based on dataset mean and variance, is absolutely critical to ensure stable model convergence and optimal training performance.
Maximizing Robustness with Data Augmentation Techniques
One of the most pervasive challenges in training deep learning models for remote sensing is the scarcity of perfectly annotated, high-quality ground truth data in diverse geographic regions. Creating these datasets is a phenomenally expensive and time-consuming manual task. To maximize the utility of the available data and prevent the neural networks from overfitting, a scenario where the model simply memorizes the training data and fails to generalize to new, unseen imagery, practitioners heavily rely on data augmentation techniques. Data augmentation artificially expands the size and diversity of the training dataset by applying a series of random, controlled transformations to the existing image patches and their corresponding masks during the training process. Geometric augmentations are particularly crucial for satellite imagery, as buildings can appear in any orientation from a nadir view. These include random rotations (e.g., rotating images by 90, 180, or 270 degrees), vertical and horizontal flipping, and random scaling to simulate variations in satellite altitude or sensor resolution. Beyond geometric changes, radiometric or color augmentations are employed to simulate different environmental and lighting conditions. Techniques such as color jittering (randomly adjusting brightness, contrast, saturation, and hue), adding artificial Gaussian noise, or applying synthetic cloud and shadow overlays force the deep learning framework to focus on the fundamental structural features of the buildings rather than relying on specific, localized color values. By exposing the model to this vast, artificially generated variety of visual scenarios, data augmentation drastically improves the model's robustness, allowing it to perform accurately across different seasons, weather conditions, and geographic landscapes.
Model Training: Loss Functions and Optimizers
The actual training of a deep learning model for footprint extraction is an iterative optimization process governed by two critical components: the loss function and the optimizer. The loss function serves as the mathematical compass for the network, quantifying the difference between the model's predicted building footprints and the actual ground truth masks. In semantic segmentation tasks, the most common starting point is the Binary Cross-Entropy (BCE) loss, which calculates the error for each pixel individually. But building footprint extraction inherently suffers from severe class imbalance; in a typical satellite image, the number of background pixels (roads, trees, grass) massively outnumbers the building pixels. If a model simply predicts "background" for every pixel, it might achieve 90% accuracy while failing entirely at its actual task. To combat this, researchers utilize specialized loss functions like the Dice Coefficient Loss or the Jaccard Index (Intersection over Union) Loss. These functions evaluate the overlap between the predicted and true building areas as a whole, heavily penalizing the model when it misses buildings, thereby mitigating the class imbalance problem. Another advanced option is Focal Loss, which dynamically scales the loss based on prediction confidence, forcing the model to focus its learning capacity on the hardest-to-classify pixels, such as ambiguous building edges. The optimizer, on the other hand, is the algorithm responsible for updating the network's weights to minimize this loss. Algorithms like Stochastic Gradient Descent (SGD) with momentum or the Adaptive Moment Estimation (Adam) optimizer are the industry standards. Adam, in particular, is highly favored because it dynamically adapts the learning rate for individual network parameters, facilitating faster convergence and more stable training dynamics in complex, high-dimensional spaces.
Evaluation Metrics: Measuring Extraction Success
Accurately quantifying the performance of a deep learning framework is essential for comparing different architectures and ensuring the model meets the rigorous standards required for real-world GIS applications. Standard classification metrics like overall pixel accuracy are highly misleading in building extraction due to the class imbalance. Therefore, the remote sensing community relies on a specific set of robust evaluation metrics.
Primary Metrics for Building Extraction
- Intersection over Union (IoU): Also known as the Jaccard Index, IoU calculates the area of overlap between the predicted building footprint and the ground truth footprint, divided by the total area of their union. It provides a strict and reliable measure of spatial precision.
- Precision: This metric measures the percentage of predicted building pixels that are actually buildings, highlighting the model's tendency to generate false alarms (false positives).
- Recall (Sensitivity): Recall measures the percentage of actual building pixels that the model successfully identified, indicating its ability to find all existing structures without missing any.
- F1-Score: The harmonic mean of Precision and Recall, the F1-Score provides a single, balanced metric that encapsulates both aspects of the model's performance, preventing researchers from favoring one over the other.
By rigorously analyzing these metrics, data scientists can fine-tune their probability thresholds, optimize their network architectures, and confidently deploy models that deliver dependable, high-fidelity extraction results across various test datasets.
Post-Processing: Refining Results and Vectorization
The raw output generated by a deep learning framework like U-Net or Mask R-CNN is typically a raster probability map, where each pixel contains a value between 0 and 1 representing the likelihood that it belongs to a building. While this raster format is useful for initial visualization, it is not directly applicable for most GIS workflows, which require clean, structured vector data (polygons). Therefore, post-processing is a mandatory and highly critical step in the automated extraction pipeline. The first phase of post-processing involves binarizing the probability map using a defined threshold (e.g., converting all pixels with a probability greater than 0.5 to 1, and the rest to 0). Even with state-of-the-art models, this binary mask often contains minor imperfections, such as tiny isolated clusters of false positive pixels (noise) or small gaps and holes within actual building predictions. To clean this up, morphological image processing operations are applied. The "opening" operation removes small, noisy pixel clusters, while the "closing" operation fills in small holes and gaps within the predicted structures. Once the raster mask is smoothed, vectorization algorithms are deployed to trace the boundaries of the connected pixel regions, generating preliminary polygons. But these initial polygons often feature jagged, staircase-like edges that follow the grid of the raster pixels, which is uncharacteristic of man-made structures. To resolve this, polygon regularization and simplification algorithms, such as the Douglas-Peucker algorithm, are heavily utilized. These algorithms mathematically simplify the complex, jagged boundaries into clean, orthogonal shapes with straight lines and sharp right angles, ultimately producing building footprints that closely mimic the precision and aesthetic quality of human-digitized maps.
Transformative Real-World Applications
The ability to rapidly and automatically extract building footprints at a massive scale has unlocked a wealth of transformative applications across numerous sectors, fundamentally altering how we manage and interact with our environment. In the field of urban planning and smart city development, municipal governments utilize this automated data to monitor urban sprawl, identify informal settlements, and optimize the layout of essential infrastructure such as road networks, sewage systems, and electrical grids. By tracking changes in building density over time, planners can make highly informed, data-driven decisions regarding zoning laws and resource allocation. Perhaps the most critical application, however, lies in disaster management and humanitarian response. In the immediate aftermath of catastrophic events like earthquakes, hurricanes, or massive floods, emergency responders desperately require rapid, up-to-date maps to assess structural damage and coordinate rescue efforts. Deep learning frameworks can process post-disaster satellite imagery in a matter of hours, automatically comparing the newly extracted footprints against pre-disaster baselines to instantly pinpoint destroyed or heavily damaged neighborhoods, enabling faster, more effective deployment of life-saving resources. Also, this technology plays a pivotal role in demography and population estimation. By combining building footprint area and volume data with census statistics, researchers can generate highly accurate, high-resolution population density maps, which are essential for epidemiological modeling and public health planning. Also, in the commercial sector, insurance companies and taxation authorities leverage automated footprint extraction to verify property boundaries, assess real estate values, and detect unpermitted construction, ensuring fair taxation and accurate risk modeling.
Challenges, Limitations, and Future Directions
Despite the breathtaking advancements in deep learning for automated building footprint extraction, several formidable challenges remain, driving ongoing research in the field. One of the most significant hurdles is geographical generalization. A neural network trained exclusively on satellite imagery from North American suburbs, which typically feature detached houses with sloping roofs, will often perform poorly when deployed over dense, high-rise urban centers in Asia or informal settlements in Africa, where building materials, architectural styles, and urban layouts are drastically different. Ensuring that models generalize well across diverse global environments requires the curation of massive, highly diverse, and globally representative training datasets. Another persistent issue is occlusion. Buildings are frequently partially or completely obscured by heavy cloud cover, thick tree canopies, or deep shadows cast by neighboring skyscrapers. While advanced data augmentation can help, optical imagery alone simply cannot see through clouds or dense foliage. To combat this, researchers are increasingly moving toward multi-modal data fusion. By combining optical RGB imagery with Synthetic Aperture Radar (SAR) data, which can penetrate clouds and operate at night, or Light Detection and Ranging (LiDAR) data, which provides highly accurate 3D elevation profiles, deep learning models can overcome the limitations of single-sensor inputs. Looking to the future, the field is heavily focused on semi-supervised and unsupervised learning techniques, which aim to reduce the industry's crippling reliance on massive datasets of manually labeled ground truth. By developing algorithms that can learn from vast amounts of unlabeled satellite imagery, the remote sensing community hopes to unlock even faster, more universally applicable automated extraction systems, pushing the boundaries of what is possible in geospatial analysis.
Conclusion
The integration of deep learning for automated building footprint extraction represents one of the most significant technological leaps in the history of remote sensing and geographic information systems. By harnessing the extraordinary pattern recognition capabilities of advanced neural network architectures like U-Net and Mask R-CNN, we have transitioned from an era of slow, painstaking manual digitization to one of rapid, scalable, and highly accurate automated mapping. This technological revolution is not merely an academic achievement; it provides the essential foundational data required to address some of the most pressing challenges of the 21st century, from managing explosive urban growth and responding to natural disasters to modeling population dynamics and optimizing infrastructure. While challenges regarding geographical generalization, occlusion, and data dependency remain, the continuous evolution of deep learning frameworks, the proliferation of very high-resolution commercial satellite imagery, and the exciting potential of multi-modal data fusion guarantee that these automated systems will only become more robust and capable in the years to come. As these technologies continue to mature and become increasingly democratized, they will undoubtedly empower a new generation of scientists, planners, and policymakers to understand, manage, and sustainably develop our rapidly changing world with unparalleled clarity and precision.
Frequently Asked Questions
What deep learning models are used for building footprint extraction?
Convolutional Neural Networks (CNNs), particularly semantic segmentation models like U-Net, Mask R-CNN, and DeepLabV3, are widely used to accurately trace and extract building footprints from high-resolution satellite imagery.
How does automated building extraction work?
The deep learning model is trained on thousands of annotated satellite images. It learns to recognize the geometric shapes, edges, textures, and roof colors of buildings, allowing it to predict and generate vector polygons for new unseen areas.
What are the main challenges in extracting building footprints?
Challenges include varying architectural styles, shadows obscuring building edges, dense urban areas where structures overlap, and tree canopies blocking the view of roofs from the satellite.
