Mapping Urban Heat Islands with Machine Learning Algorithms
Table of Contents
- 1. The Anatomy of the Urban Heat Island Effect
- 2. Key Data Sources and Feature Engineering for UHI Mapping
- 2.1. Remote Sensing and Thermal Satellite Imagery
- 2.2. Feature Engineering: Spectral Indices
- 2.3. Urban Morphology, 3D Geometry, and Anthropogenic Data
- 3. ML Algorithms for Urban Heat Island Mapping
- 3.1. Ensemble Tree-Based Models: Random Forest and Gradient Boosting Architectures
- 3.2. Support Vector Regression (SVR) and Gaussian Process Regression (GPR)
- 3.3. Deep Learning: Convolutional Neural Networks (CNNs) for Spatial Context
- 3.4. Advanced Spatiotemporal Modeling with RNNs, LSTMs, and Transformers
- 4. Developing a Robust Machine Learning Pipeline for UHI Modeling
- Step 1: Geospatial Data Acquisition, Harmonization, and Downscaling
- Step 2: Intelligent Feature Selection and Dimensionality Reduction
- Step 3: Spatial Cross-Validation Strategy
- Step 4: Hyperparameter Optimization
- Step 5: Rigorous Evaluation Metrics
- 5. Actionable Predictive Modeling and UHI Mitigation Strategies
- 5.1. Algorithmic Simulation of Urban Interventions
- 5.2. Future Climate Change Scenario Forecasting
- 5.3. Heat Vulnerability Mapping and Environmental Justice
- 6. Key Challenges, Algorithmic Limitations, and Future Horizons
- 6.1. Solving the Spatiotemporal Resolution Trade-off
- 6.2. Explainable AI (XAI) in Urban Climatology
- 6.3. Bridging the Gap: From Surface UHI to Canopy UHI
- 6.4. The Evolution Towards Urban Digital Twins
- Conclusion
- Frequently Asked Questions
rsandgis.me
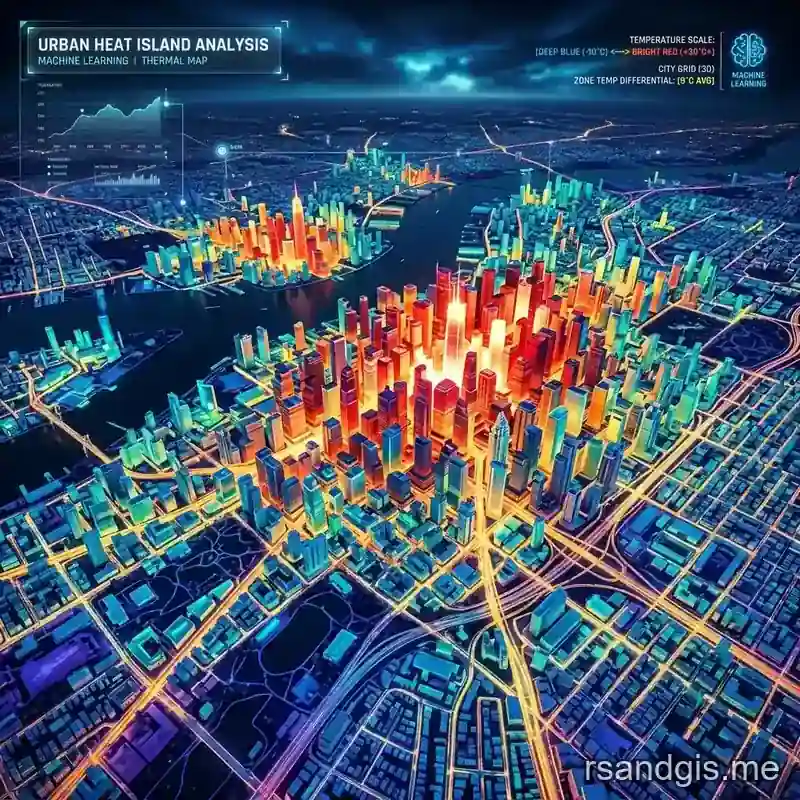
The Urban Heat Island (UHI) effect stands as one of the most pressing environmental and public health challenges of the 21st century. As global urbanization accelerates at an unparalleled pace and anthropogenic climate change intensifies baseline temperatures, metropolitan areas are experiencing significantly higher temperatures compared to their surrounding rural or peri-urban environments. This phenomenon not only severely degrades local air quality and exponentially increases cooling energy consumption but also poses severe, sometimes fatal, health risks to vulnerable demographic populations through heat stress and heat strokes. Historically, the process of quantifying and mapping UHI relied on either sparse, unevenly distributed meteorological station data or coarse-resolution satellite imagery. These conventional methods often failed to capture the intricate spatial heterogeneity and microclimatic nuances of complex urban thermal environments. Today, however, the convergence of big Earth observation data, cloud computing platforms like Google Earth Engine, and advanced artificial intelligence has sparked a monumental revolution in urban climatology. Specifically, the application of machine learning for urban heat island mapping has emerged as the definitive, state-of-the-art approach for generating high-resolution, dynamically updating, and predictive models of urban thermal landscapes.
This comprehensive, highly technical guide explores the sophisticated methodologies, underlying algorithms, critical data sources, and advanced analytical pipelines that define modern machine learning for urban heat island mapping. Whether you are an environmental data scientist seeking to optimize regression models, a remote sensing specialist dealing with multi-spectral satellite imagery, or an urban planner searching for actionable mitigation strategies, a deep understanding of these computational frameworks is absolutely essential for building the climate-resilient cities of tomorrow.
1. The Anatomy of the Urban Heat Island Effect
Before diving into the complexities of machine learning algorithms and hyperparameter optimization, it is fundamentally crucial to mathematically and physically delineate the types of UHI and the thermodynamic processes driving them. Machine learning models must be trained on precise target variables. The UHI effect is scientifically categorized into three distinct spatiotemporal types, each requiring different measurement and modeling approaches:
- Surface Urban Heat Island (SUHI): Driven directly by Land Surface Temperature (LST), SUHI is most pronounced during the daytime when shortwave solar radiation continuously heats impervious, low-albedo urban surfaces such as asphalt roads, concrete buildings, and industrial rooftops. SUHI exhibits extreme spatial variability, highly sensitive to micro-level land cover variations. Because LST can be directly retrieved from thermal infrared (TIR) satellite sensors, SUHI is the primary focus of the vast majority of remote sensing and machine learning for urban heat island mapping research.
- Canopy Layer Urban Heat Island (CUHI): This refers to the warming of the ambient air temperature in the urban canopy layer, the zone extending from the ground up to the mean height of buildings and trees where human activities occur. CUHI is most intense at night, as urban materials release the sensible heat absorbed during the day. It is strongly influenced by complex urban geometry (street canyons trapping longwave radiation), anthropogenic heat emissions (HVAC systems, vehicle exhaust), and restricted wind flow patterns. Modeling CUHI requires complex fluid dynamics or dense in-situ sensor networks, making spatial interpolation via machine learning critical.
- Boundary Layer Urban Heat Island (BLUHI): Extending from the top of the urban canopy up into the planetary boundary layer (often up to 1-2 kilometers in altitude), BLUHI represents the macro-regional scale atmospheric warming situated directly over a metropolitan footprint. It affects regional weather patterns, including precipitation anomalies downwind of major cities.
Traditional empirical models, such as ordinary least squares (OLS) linear regression, often failed spectacularly when confronted with the highly non-linear, multi-collinear relationships between complex urban morphology, heterogeneous land cover, and resulting land surface temperatures. The intricate spatial complexity of modern cities, characterized by a fragmented mosaic of high-rise buildings, urban forests, localized water bodies, and sprawling industrial parks, creates highly localized microclimates that linear statistical models cannot accurately predict. Herein lies the profound power of machine learning: the inherent algorithmic ability to automatically uncover deeply complex, multi-dimensional, and non-linear spatiotemporal patterns within massive terabyte-scale geospatial datasets.
2. Key Data Sources and Feature Engineering for UHI Mapping
The ultimate predictive success of any machine learning model is intrinsically and inescapably tied to the quality, resolution, and diversity of its input training data. In the field of geospatial data science, "garbage in, garbage out" is an absolute law. For robust machine learning for urban heat island mapping, researchers typically employ sophisticated data fusion techniques to combine multiple, disparate data modalities.
2.1. Remote Sensing and Thermal Satellite Imagery
Multispectral and thermal satellite sensors form the empirical backbone of modern UHI analysis. The accurate derivation of Land Surface Temperature (LST) from satellite thermal infrared (TIR) bands serves as the foundational, ground-truth target variable (the "Y" variable) for supervised learning models predicting SUHI.
- Landsat 8 and Landsat 9: The gold standard for medium-resolution analysis. Offering a spatial resolution of 100 meters (routinely mathematically resampled to 30m) for their Thermal Infrared Sensors (TIRS) and native 30m for multispectral bands (OLI), Landsat provides the critical granular detail required for intra-urban, neighborhood-scale analysis. Its primary limitation is the 16-day orbital revisit time, which restricts continuous temporal monitoring and increases vulnerability to cloud cover.
- MODIS (Moderate Resolution Imaging Spectroradiometer): Aboard NASA's Terra and Aqua satellites, MODIS provides invaluable diurnal LST data (capturing data up to 4 times a day) but at a coarse 1-kilometer spatial resolution. This makes MODIS highly suitable for macro-regional temporal trend analysis and capturing the diurnal UHI cycle, but insufficient for localized urban planning.
- ECOSTRESS (ECOsystem Spaceborne Thermal Radiometer Experiment on Space Station): Mounted on the ISS, ECOSTRESS provides unparalleled high-resolution thermal imagery (70m) at varying times of the day and night. This unique orbit allows researchers to accurately capture and model the full diurnal UHI warming and cooling cycle with high spatial fidelity.
- Sentinel-2: While lacking thermal sensing capabilities, the European Space Agency's Sentinel-2 constellation offers 10m high-resolution multispectral data. This data is absolutely invaluable for deriving highly precise vegetation, moisture, and urban indices used as predictor variables (features) in machine learning algorithms.
2.2. Feature Engineering: Spectral Indices
To train effective and physically meaningful machine learning models, raw satellite reflectance values (Digital Numbers or Top-of-Atmosphere reflectance) must be transformed into scientifically validated biophysical indices. These calculated indices represent the fundamental characteristics of the urban landscape acting as independent predictor variables (the "X" features):
- Normalized Difference Vegetation Index (NDVI) and Enhanced Vegetation Index (EVI): Crucial proxies for vegetation biomass, density, and photosynthetic health. Vegetation is the primary mitigator of UHI through the thermodynamic processes of evapotranspiration (converting sensible heat to latent heat) and direct surface shading. High NDVI strongly correlates with lower LST.
- Normalized Difference Built-up Index (NDBI) and Urban Index (UI): Specifically designed to mathematically highlight impervious surfaces and densely built environments. These materials possess high thermal inertia and low albedo, acting as massive thermal storage batteries that absorb shortwave radiation by day and emit longwave radiation by night, making them the primary drivers of UHI.
- Normalized Difference Water Index (NDWI) and Modified NDWI (MNDWI): Used to isolate and map surface water bodies (lakes, rivers, reservoirs). Water bodies possess high specific heat capacity, acting as crucial thermal sinks that moderate local urban microclimates.
- Surface Albedo: The quantified measure of broadband surface reflectivity. Low albedo surfaces (like fresh asphalt) absorb vast amounts of solar radiation, directly exacerbating the SUHI effect. Machine learning models often identify albedo as a top-tier feature importance metric.
2.3. Urban Morphology, 3D Geometry, and Anthropogenic Data
While spectral indices capture 2D land cover, urban heat is a profoundly 3D phenomenon. Modern machine learning approaches integrate structural and socioeconomic geospatial data to dramatically improve predictive accuracy and physical realism.
- Sky View Factor (SVF) and Building Height: Derived from LiDAR (Light Detection and Ranging) point clouds or high-resolution Digital Surface Models (DSMs). A low SVF (deep, narrow street canyons) drastically reduces the release of longwave radiation at night, amplifying the nocturnal CUHI effect.
- Anthropogenic Heat Flux (AHF): The direct heat emissions from human activity. While difficult to measure directly from space, machine learning models use proxy features such as localized population density maps (from census data or mobile phone trajectories), traffic volume sensor networks, and nighttime light intensity (from the VIIRS sensor) to estimate the contribution of AHF to the thermal environment.

3. ML Algorithms for Urban Heat Island Mapping
The selection of the specific algorithmic architecture fundamentally dictates the model's predictive capability, computational efficiency, and, crucially, its scientific interpretability. Below is an exhaustive technical analysis of the most effective supervised learning frameworks utilized in machine learning for urban heat island mapping.
3.1. Ensemble Tree-Based Models: Random Forest and Gradient Boosting Architectures
Decision tree-based ensemble methods remain the industry workhorses and are highly favored in applied UHI climatology studies. They offer robust resistance to statistical outliers, do not strictly require complex data normalization/scaling, and possess an inherent mathematical ability to smoothly handle complex, non-linear relationships and complex interactions between geospatial features.
- Random Forest (RF) Regression: An ensemble learning method that operates by constructing a vast multitude of decision trees during the training phase. For regression tasks like continuous LST prediction, it outputs the mean prediction of the individual, uncorrelated trees. In the context of UHI, RF excels at mapping LST based on a diverse stack of spectral indices (NDVI, NDBI), DEM topography, and categorical Land Use/Land Cover (LULC) data. Crucially, RF provides mathematically sound "Feature Importance" scores (via Mean Decrease Impurity or Permutation Importance), which allow researchers and policymakers to definitively identify the most critical physical drivers of UHI within their specific geographic jurisdiction.
- Extreme Gradient Boosting (XGBoost) and LightGBM: These advanced boosting frameworks sequentially build shallow decision trees, where each newly added tree is specifically optimized to mathematically correct the residual errors (the loss gradient) of the previously combined trees. XGBoost and LightGBM almost universally outperform standard Random Forest in sheer predictive accuracy (minimizing RMSE). Also, they are highly optimized for parallel processing. LightGBM, in particular, utilizes exclusive feature bundling and histogram-based decision tree algorithms, making it exceptionally fast and highly adept at processing massive, high-resolution urban geospatial datasets without triggering memory exhaustion errors.
3.2. Support Vector Regression (SVR) and Gaussian Process Regression (GPR)
Support Vector Regression attempts to map the non-linear input features into a higher-dimensional mathematical feature space using advanced kernel functions (most commonly the Radial Basis Function - RBF kernel). It then locates a hyperplane that best fits the geospatial data within a strictly specified margin of error tolerance (the epsilon tube). While SVR can be computationally prohibitive when applied to massive, regional-scale satellite imagery with millions of pixels, it is highly effective and theoretically sound for localized, small-scale UHI mapping (e.g., analyzing a single neighborhood or park) where high precision and strict error bounds are paramount. Similarly, Gaussian Process Regression offers non-parametric, Bayesian approaches that provide not just LST predictions, but invaluable confidence intervals (uncertainty mapping) for every single predicted pixel.
3.3. Deep Learning: Convolutional Neural Networks (CNNs) for Spatial Context
A severe fundamental limitation of traditional pixel-based machine learning models (like RF or SVR) is that they process every geospatial pixel in complete isolation. They mathematically ignore the crucial spatial context, neighborhood effects, and topological relationships between adjacent pixels. In urban climatology, this is a fatal flaw: the thermal characteristic of a specific building roof is heavily influenced by the immediate thermal dynamics of its surrounding environment (e.g., is it adjacent to a massive, cooling urban forest or surrounded by a vast, heat-absorbing asphalt parking lot?).
Deep Learning, specifically Convolutional Neural Networks (CNNs), elegantly addresses this spatial limitation. CNNs utilize sliding convolutional kernels (filters) to extract complex, hierarchical spatial features directly from multi-band image patches rather than isolated pixels. Advanced semantic segmentation architectures, such as U-Net, DeepLabV3+, or specialized ResNet variants, are heavily employed. These networks can perform complex image-to-image translation, for example, directly translating a 10-band multi-spectral optical satellite image and a DEM directly into a continuous, high-fidelity LST map. By inherently capturing complex spatial context and texture, CNNs consistently produce highly accurate, visually continuous UHI spatial distribution maps that traditional pixel-based models fundamentally cannot match.
3.4. Advanced Spatiotemporal Modeling with RNNs, LSTMs, and Transformers
The urban thermal environment is never static; the UHI effect fluctuates wildly on a diurnal (day/night) basis and evolves seasonally. To capture these profound temporal dynamics, researchers deploy Recurrent Neural Networks (RNNs) and, more specifically, Long Short-Term Memory (LSTM) networks. LSTMs are uniquely designed to ingest sequential time-series data (from weather stations or high-frequency geostationary satellites) to predict future UHI intensities based on learned historical climatological patterns.
The bleeding-edge of machine learning for urban heat island mapping involves spatiotemporal fusion networks, such as Convolutional LSTMs (ConvLSTM) or Vision Transformers (ViT). These monumental architectures simultaneously model the spatial context (the urban morphology) and the temporal evolution (the diurnal warming cycle), allowing for continuous, dynamic, and highly predictive 4D thermal mapping of metropolitan areas.

4. Developing a Robust Machine Learning Pipeline for UHI Modeling
Successfully executing a machine learning project for UHI mapping is rarely a plug-and-play endeavor. It requires a rigorous, scientifically sound, multi-stage data engineering pipeline. The inherent complexity, noise, and vast scale of geospatial Earth observation data demand meticulous algorithmic preprocessing to ensure the final model maintains scientific validity.
Step 1: Geospatial Data Acquisition, Harmonization, and Downscaling
The absolute primary challenge in multi-sensor remote sensing is resolving spatiotemporal resolution mismatch.
For instance, attempting to combine 30-meter Landsat LST data with 10-meter Sentinel-2 vegetation indices and 1-kilometer MODIS temporal data requires sophisticated mathematical data fusion. Downscaling algorithms, which are increasingly powered by machine learning frameworks themselves (e.g., using a Random Forest model to spatially downscale coarse MODIS LST based on fine-resolution Sentinel-2 predictor variables), are rigorously employed to harmonize spatial resolutions. All spatial data layers must be meticulously georegistered, subjected to rigorous atmospheric correction (e.g., utilizing algorithms like FLAASH or Sen2Cor), and geographically stacked into a unified multi-band geospatial data cube or tensor.
Step 2: Intelligent Feature Selection and Dimensionality Reduction
Blindly feeding dozens of highly correlated spectral indices (e.g., NDVI, SAVI, EVI, MSAVI) into a machine learning algorithm inevitably leads to the dreaded "curse of dimensionality" and severe statistical multicollinearity. This degrades model performance and destroys feature interpretability. Advanced techniques such as Principal Component Analysis (PCA), Independent Component Analysis (ICA), or algorithm-driven Recursive Feature Elimination (RFE) are rigorously used to mathematically select a parsimonious, highly orthogonal set of predictor variables. Selecting the optimized feature space is crucial for maximizing model interpretability and preventing mathematical overfitting on training data.
Step 3: Spatial Cross-Validation Strategy
Standard random k-fold cross-validation is mathematically inadequate and scientifically flawed when applied to geospatial data. This is due to the phenomenon of spatial autocorrelation, dictated by Tobler's First Law of Geography ("everything is related to everything else, but near things are more related than distant things"). Randomly splitting adjacent, highly correlated pixels into separate training and testing sets leads to severe information leakage, resulting in wildly overly optimistic accuracy metrics that fail in real-world deployment.
To combat this, rigorous Spatial Cross-Validation must be implemented. The urban study area is divided into distinct geographic blocks or spatial clusters (e.g., using k-means spatial clustering). The model is comprehensively trained on certain geographic blocks and strictly tested on entirely separate, geographically distant blocks. This ensures that the algorithm actually learns the underlying physics of urban heat and generalizes robustly to entirely unseen urban topographies.
Step 4: Hyperparameter Optimization
Tuning the internal settings of the algorithms is essential for peak performance. For complex tree-based models like XGBoost, tuning parameters such as maximum tree depth, minimum child weight, subsample ratios, and learning rates is conducted using exhaustive Grid Search, Randomized Search, or advanced Bayesian Optimization algorithms (like Hyperopt). This step delicately balances the fundamental bias-variance tradeoff, ensuring the model is complex enough to capture subtle UHI micro-nuances but mathematically generalized enough to perform flawlessly on new satellite acquisitions.
Step 5: Rigorous Evaluation Metrics
Model performance in continuous LST prediction is evaluated using a suite of rigorous statistical metrics to quantify error margins:
- Root Mean Square Error (RMSE): Strongly penalizes large prediction errors. This is crucial in UHI studies to ensure that extreme, dangerous heat hotspots are not mathematically smoothed over or underestimated by the model.
- Mean Absolute Error (MAE): Provides a clear, straightforward measure of average error magnitude, directly interpretable in degrees Celsius or Kelvin.
- Coefficient of Determination (R²): A statistical measure indicating the proportion of variance in the true Land Surface Temperature that is successfully explained by the model's predictor features.
5. Actionable Predictive Modeling and UHI Mitigation Strategies
The ultimate objective of deploying machine learning for urban heat island mapping extends far beyond mere academic observation; it is fundamentally about generating predictive analytics and actionable climate mitigation strategies. Urban planners, mayors, and environmental policymakers leverage these advanced models in several critical, life-saving applications.
5.1. Algorithmic Simulation of Urban Interventions
Trained machine learning models function as highly capable digital testing grounds. By mathematically altering the input features, such as synthetically increasing the NDVI spatial values to simulate planting 10,000 trees in a specific concrete-heavy neighborhood, or lowering the albedo feature values for commercial rooftops to simulate a city-wide "cool roof" mandate, the model instantly predicts the resultant, localized decrease in Land Surface Temperature. This allows city planners to quantitatively evaluate and optimize the cooling efficacy of proposed green infrastructure (urban parks, green roofs, bioswales) before massive capital is financially committed to construction.
5.2. Future Climate Change Scenario Forecasting
By computationally integrating macroscopic Global Climate Models (GCMs) with microscopic, high-resolution urban machine learning models, climatologists can accurately forecast exactly how the local UHI intensity will mathematically exacerbate under various future IPCC greenhouse gas emission scenarios (the Shared Socioeconomic Pathways - SSPs). This localized predictive capability is absolutely vital for long-term municipal urban resilience planning, emergency response preparation, and grid load forecasting for electricity providers.
5.3. Heat Vulnerability Mapping and Environmental Justice
High-resolution ML-derived thermal heat maps are frequently overlaid with complex demographic and socioeconomic census datasets (e.g., household income levels, age demographics, prevalence of underlying cardiovascular health conditions, access to air conditioning) to algorithmically generate comprehensive Heat Vulnerability Indices (HVI). This critical analysis frequently reveals profound, systemic environmental inequities, definitively showing that low-income or marginalized communities often disproportionately reside in the most severe, high-temperature urban heat islands, critically lacking adequate tree canopy cover and green spaces. Targeting focused mitigation efforts and emergency cooling centers toward these specific, data-identified micro-zones is now a primary objective of data-driven urban climate policy.
6. Key Challenges, Algorithmic Limitations, and Future Horizons
Despite the remarkable, paradigm-shifting advancements, the field of machine learning for urban heat island mapping faces several complex systemic challenges that the global research community is actively working to overcome through algorithmic innovation.
6.1. Solving the Spatiotemporal Resolution Trade-off
As previously mentioned, current orbital satellite technology forces researchers into a compromising choice: high spatial resolution with infrequent temporal revisits (Landsat) or frequent temporal revisits with coarse spatial resolution (MODIS). While advanced spatio-temporal fusion models (such as the STARFM algorithm or complex deep learning-based STFDN networks) attempt to algorithmically synthesize high-resolution, daily LST data, these synthetically generated datasets inherently carry and propagate modeled statistical uncertainties. The deployment of high-resolution commercial thermal microsatellite constellations (like those planned by Satellite Vu or Albedo) will eventually mitigate this hardware limitation, providing massive new data streams for ML models.
6.2. Explainable AI (XAI) in Urban Climatology
As complex deep learning models (CNNs, ConvLSTMs) increasingly dominate the academic field due to their superior predictive accuracy, their inherent "black box" mathematical nature becomes a severe liability for practical policy formulation. Urban planners and politicians need to know *why* an algorithm predicts a specific heat hotspot, not just *where* it is located. The widespread integration of Explainable AI (XAI) techniques, such as SHAP (SHapley Additive exPlanations) values or LIME (Local Interpretable Model-agnostic Explanations), is rapidly becoming an absolute mandate. These sophisticated techniques mathematically demystify complex neural networks, definitively revealing the exact marginal contribution of specific urban features (e.g., explaining exactly how much a 10% decrease in Sky View Factor or a 5% increase in asphalt cover contributes to localized temperature rise in a specific 30x30 meter grid cell).
6.3. Bridging the Gap: From Surface UHI to Canopy UHI
The vast majority of current machine learning studies exclusively focus on Surface UHI (SUHI) simply because continuous LST is readily observable globally from space. But actual human thermal comfort, heat stress, and public health outcomes are primarily dictated by Canopy UHI (ambient air temperature, Ta) and complex thermodynamic variables like localized humidity and wind speed. Mapping high-resolution air temperature requires establishing dense, expensive networks of IoT weather sensors or utilizing vast amounts of crowdsourced citizen science data (e.g., Netatmo personal weather stations). This sparse point data must then be combined with advanced machine learning spatial interpolation techniques (like Random Forest spatial interpolation, geographically weighted regression, or advanced Kriging) to create continuous air temperature maps. Bridging this critical gap between satellite-derived SUHI observations and sensor-derived CUHI realities remains the most critical scientific frontier in urban microclimatology.
6.4. The Evolution Towards Urban Digital Twins
The ultimate future of data-driven UHI mitigation definitively lies in the construction of Urban Digital Twins. These are dynamic, hyper-realistic 3D virtual replicas of entire metropolitan areas that smoothly integrate real-time IoT sensor data, massive 3D urban morphology databases (Building Information Modeling - BIM and 3D GIS), and real-time machine learning predictive engines. These sophisticated systems will soon allow for the continuous real-time monitoring of urban thermal stress and the instant, computationally inexpensive simulation of complex microclimatic interventions, pushing the absolute boundaries of what is scientifically and computationally possible in modern urban environmental management.
Conclusion
The seamless integration of advanced, scalable machine learning algorithms with massive repositories of Earth observation data has fundamentally transformed humanity's collective ability to thoroughly understand, accurately map, and actively mitigate urban thermal extremes. The application of machine learning for urban heat island mapping is no longer just an abstract academic exercise confined to remote sensing journals; it has rapidly evolved into an indispensable, life-saving analytical tool for urban resilience and climate adaptation. By strategically leveraging ensemble decision trees, complex deep learning architectures, and multi-source spatial data fusion, the scientific community can move far beyond static, historical thermal observations to generate dynamic, highly predictive, and instantly actionable insights. As global metropolitan populations continue to expand rapidly and baseline global temperatures inevitably rise due to climate change, continuously refining these sophisticated computational models, vastly improving multi-sensor data fusion techniques, and fiercely ensuring algorithmic interpretability through XAI will be absolutely paramount in intelligently designing the sustainable, equitable, and heat-resilient megacities of the near future. The underlying algorithms are mathematically powerful, the orbital and in-situ data is increasingly abundant, and the moral and practical imperative for immediate climate action has never been clearer or more urgent.
Frequently Asked Questions
How does machine learning improve Urban Heat Island (UHI) mapping?
Traditional UHI mapping relies on basic thermal satellite bands. Machine learning models (like Random Forest or Neural Networks) combine thermal data with complex urban features (building height, vegetation indices, albedo, and traffic data) to accurately predict localized heat stress block-by-block.
What is the primary cause of the Urban Heat Island effect?
UHIs are primarily caused by the replacement of natural vegetation with dense concentrations of pavement, buildings, and other surfaces that absorb and retain heat, compounded by waste heat generated from vehicles and air conditioning.
Can GIS algorithms simulate heat mitigation strategies?
Yes, GIS-based machine learning models can run predictive scenarios, such as simulating the cooling effect of planting 10,000 trees or converting roofs to 'green roofs', allowing city planners to quantify temperature reductions before spending public funds.
