Hyperspectral Remote Sensing for Mineral Exploration
Table of Contents
- 1. The Physics and Principles of Imaging Spectroscopy
- 1.1. Absorption Features: The Key to Mineral Identification
- 1.2. The Anatomy of the Hyperspectral Data Cube
- 2. Critical Spectral Regions in Mineral Exploration
- 2.1. Visible and Near-Infrared (VNIR: 400 – 1000 nm)
- 2.2. Short-Wave Infrared (SWIR: 1000 – 2500 nm)
- 2.3. Thermal Infrared (TIR: 8000 – 14000 nm)
- 3. Hyperspectral Sensors and Acquisition Platforms
- 3.1. Satellite-Based Sensors (Spaceborne)
- 3.2. Airborne Systems
- 3.3. Unmanned Aerial Vehicles (UAVs / Drones)
- 3.4. Ground-Based and Automated Core Scanning
- 4. The Data Processing Pipeline: From Photons to Mineral Maps
- 4.1. Radiometric and Geometric Calibration
- 4.2. Atmospheric Correction
- 4.3. Dimensionality Reduction
- 4.4. Endmember Extraction
- 4.5. Spectral Matching and Mapping Algorithms
- 5. Strategic Applications in the Mining Lifecycle
- 5.1. Grassroots Exploration and Alteration Vectoring
- 5.2. Epithermal Gold and Silver Deposits
- 5.3. Geometallurgy and Mine Operations
- 5.4. Environmental Monitoring and Remediation
- 6. Multispectral vs. Hyperspectral: Why the Leap is Necessary
- 7. Challenges and Future Frontiers
- 8. Conclusion
- Frequently Asked Questions
rsandgis.me
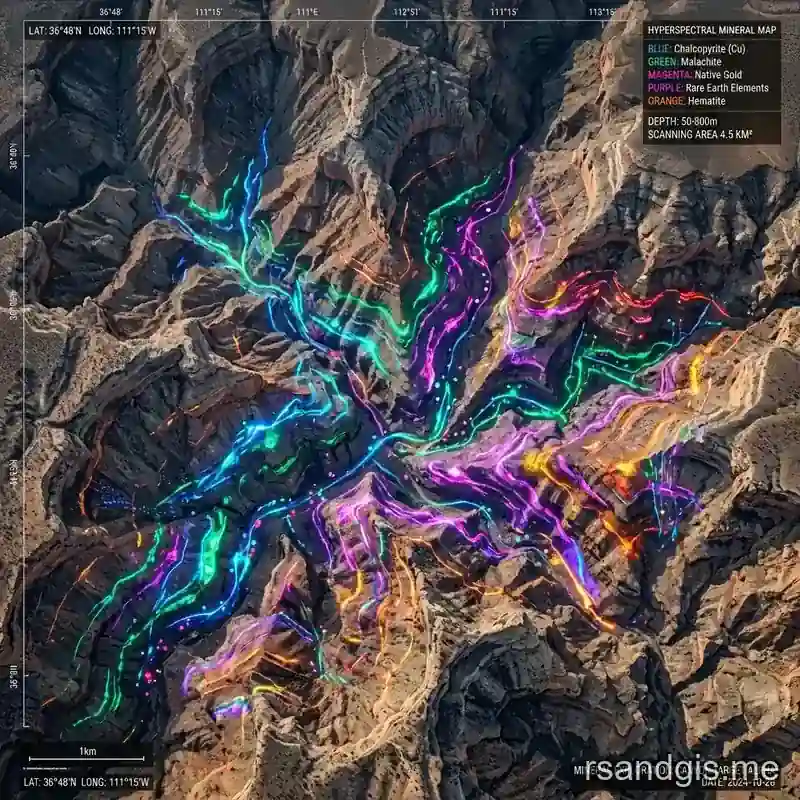
The quest for critical minerals, precious metals, and base metals has never been more vital, driven by the global transition toward renewable energy, electric mobility, and advanced technological manufacturing. As near-surface and easily detectable ore deposits become increasingly depleted, the mining and exploration industry must look deeper and explore more remote, obscured, and geologically complex regions. Enter hyperspectral remote sensing for mineral exploration, a revolutionary Earth observation and geospatial technology that has fundamentally transformed how geoscientists identify, map, and evaluate mineral deposits. By measuring the interaction of electromagnetic radiation with the Earth's surface across hundreds of narrow, contiguous spectral bands, hyperspectral imaging (HSI) bridges the crucial gap between macro-scale structural geology and micro-scale mineralogy.
In this comprehensive, highly technical guide, we will delve deep into the underlying physics of imaging spectroscopy. We will examine the critical spectral regions utilized in modern geosciences, break down the complex, multi-stage data processing pipelines required to extract actionable intelligence from photon data, and explore the diverse applications of this technology across the entire mining lifecycle. Whether you are an exploration geologist, a remote sensing specialist, a mining engineer, or a geospatial data scientist, this article provides an authoritative deep dive into the state-of-the-art of hyperspectral mineral mapping.
1. The Physics and Principles of Imaging Spectroscopy
To fully grasp the profound efficacy of hyperspectral remote sensing for mineral exploration, one must first understand the fundamental physical principles of optical spectroscopy. Every material on the Earth's surface interacts with electromagnetic (EM) radiation in a unique and predictable way. When incident solar radiation strikes an exposed rock outcrop, soil surface, or drill core, specific wavelengths are absorbed, transmitted, or reflected based entirely on the chemical composition, crystalline structure, and atomic bonding of the constituent minerals. The continuous plot of reflectance as a function of wavelength forms a diagnostic spectral signature or "spectral fingerprint."
1.1. Absorption Features: The Key to Mineral Identification
Absorption features, the characteristic "dips" or troughs observed in a spectral reflectance curve, are the primary diagnostic tools utilized in hyperspectral analysis. These features arise from two primary physical phenomena occurring at the atomic, ionic, and molecular levels:
- Electronic Processes: These processes occur predominantly in the Ultraviolet, Visible, and Near-Infrared (VNIR, 400–1000 nm) regions of the electromagnetic spectrum. They are driven by the transition of valence electrons between different energy states within an atom or ion.
For example, crystal field transitions involving transition metals like iron (Fe2+, Fe3+), copper (Cu), and chromium (Cr) produce distinct, albeit relatively broad, absorption bands. Charge transfer processes (the rapid migration of electrons between adjacent ions, such as O to Fe) also contribute to strong absorptions in the ultraviolet and visible spectrum. These processes are directly responsible for the vibrant colors of iron oxides and hydroxides like hematite, goethite, and jarosite. Also, intra-configurational electronic transitions within the f-electron shells of Rare Earth Elements (REEs) like Neodymium (Nd) and Samarium (Sm) produce extremely sharp, diagnostic "pin-stripe" absorption features that are highly prized in critical mineral exploration.
- Vibrational Processes: These phenomena dominate the Short-Wave Infrared (SWIR, 1000–2500 nm) and Thermal Infrared (TIR, 8000–14000 nm) regions. Vibrational absorptions occur when the frequency of incident electromagnetic radiation matches the fundamental vibrational frequencies (such as bending, stretching, or rocking) of molecular bonds within the mineral lattice. In the SWIR region, the observed features are typically overtones and combinations of fundamental vibrations that occur at much longer wavelengths. Critical bonds diagnosed in the SWIR include hydroxyl (O-H), water (H2O), carbonate (C-O), and sulfate (S-O). In the TIR region, the fundamental vibrations of the strong silicon-oxygen (Si-O) bond allow for the definitive identification of rock-forming silicates such as quartz, pyroxenes, and feldspars, which generally lack diagnostic features in the VNIR or SWIR.
1.2. The Anatomy of the Hyperspectral Data Cube
Traditional multispectral sensors, such as the Landsat series or Sentinel-2, collect data in a few (typically 5 to 13) broad, disjointed spectral bands. While highly useful for distinguishing broad lithological groups, calculating vegetation indices, or mapping regional lineaments, they fundamentally lack the spectral resolution required to identify specific mineral species. In sharp contrast, a hyperspectral sensor (imaging spectrometer) collects data in hundreds of narrow, contiguous bands, often with spectral bandwidths of 10 nm or less. The output is a highly dimensional, three-dimensional dataset known as a hyperspectral data cube. In this cube, the x and y dimensions represent the spatial extent of the geographic scene, and the z dimension represents the spectral information (wavelength, λ). As a result, for every single pixel in a hyperspectral image, a complete, continuous reflectance spectrum can be extracted, analyzed, and compared against laboratory standards.
2. Critical Spectral Regions in Mineral Exploration
The success of a hyperspectral remote sensing campaign heavily depends on matching the sensor's spectral range to the target minerals' diagnostic features. The electromagnetic spectrum utilized in geological remote sensing is generally divided into three primary operational domains.
2.1. Visible and Near-Infrared (VNIR: 400 – 1000 nm)
The VNIR region is highly sensitive to the presence of transition metals, making it the premier domain for mapping iron oxides, hydroxides, and certain sulfates. Minerals such as hematite, goethite, and jarosite exhibit characteristic electronic absorption features centered around 850 to 930 nm. Because these minerals are the typical end-products of the supergene weathering and oxidation of sulfide minerals (e.g., pyrite, chalcopyrite), mapping their distribution is crucial for identifying gossans and the leached caps of porphyry or epithermal ore deposits. Also, as previously mentioned, the VNIR is exceptionally useful for detecting Rare Earth Elements (REEs), which are critical for the green energy transition.
2.2. Short-Wave Infrared (SWIR: 1000 – 2500 nm)
The SWIR region is arguably the most critical and widely utilized region for hyperspectral remote sensing for mineral exploration, particularly for mapping complex hydrothermal alteration systems. Hydrothermal fluids modify the host rocks, producing spatially concentric or structurally controlled zones of characteristic alteration minerals. The SWIR region is exquisitely sensitive to molecular bonds commonly found in these alteration products:
- Al-OH Minerals (White Micas and Clays): Minerals like kaolinite, illite, muscovite, montmorillonite, and dickite display diagnostic absorption features near 2200 nm. The exact wavelength position, depth, and asymmetry of this feature can indicate the specific mineral species and its chemical composition.
For instance, the substitution of sodium (Na) for potassium (K) in the lattice of white micas (paragonite vs. muscovite) drives predictable shifts in the absorption minimum, providing a crucial vector toward hotter, more proximal zones of a hydrothermal system.
- Mg-OH and Carbonate Minerals: Chlorite, epidote, biotite, phlogopite, and various carbonates (calcite, dolomite, ankerite) exhibit primary absorption features between 2300 nm and 2350 nm. Tracking the subtle wavelength shifts within this range can help differentiate between Mg-rich and Fe-rich chlorites. In many porphyry systems, mapping the transition from Fe-chlorite to Mg-chlorite serves as a highly reliable vector toward the mineralized center.
- Sulfates: Alunite, a key indicator mineral in advanced argillic alteration zones typically associated with high-sulfidation epithermal gold deposits, displays prominent, sharp SWIR absorptions at 1480, 1760, and 2165 nm.
2.3. Thermal Infrared (TIR: 8000 – 14000 nm)
While the VNIR and SWIR are excellent for mapping hydrothermal alteration and weathering products, they are practically blind to anhydrous silicates, which make up the vast bulk of the Earth's crust. The Thermal Infrared (TIR) region elegantly fills this gap. In the TIR, minerals absorb and emit rather than reflect solar radiation. The fundamental vibrational frequencies of the Si-O framework create diagnostic emittance minima known as Reststrahlen bands in the 8 to 12 μm range. This allows for the unambiguous mapping of primary rock-forming minerals such as quartz, plagioclase feldspar, orthoclase, pyroxene, and olivine. As a result, TIR hyperspectral imaging is absolutely indispensable for primary lithological mapping, distinguishing between different intrusive phases, and identifying silicification zones that often host precious metal mineralization.

3. Hyperspectral Sensors and Acquisition Platforms
The acquisition of high-fidelity hyperspectral data requires sophisticated optomechanical engineering. The choice of platform determines the spatial resolution, signal-to-noise ratio (SNR), coverage area, and ultimately the specific phase of mineral exploration it supports.
3.1. Satellite-Based Sensors (Spaceborne)
Spaceborne hyperspectral sensors provide synoptic, regional-scale coverage, making them ideal for the grassroots reconnaissance phase of exploration. Historical limitations in spatial and spectral resolution from space are rapidly being overcome by a new generation of orbiting spectrometers.
- PRISMA (PRecursore IperSpettrale della Missione Applicativa): Launched by the Italian Space Agency (ASI), PRISMA provides high-quality data across the VNIR and SWIR regions with a 30-meter spatial resolution, acting as a powerful tool for regional alteration mapping.
- EnMAP (Environmental Mapping and Analysis Program): A state-of-the-art German hyperspectral satellite delivering 242 continuous bands from 420 nm to 2450 nm, specifically designed to monitor dynamic environmental processes and conduct detailed geological mapping.
- EMIT (Earth Surface Mineral Dust Source Investigation): Mounted on the International Space Station (ISS), NASA's EMIT sensor maps surface mineralogy across arid and semi-arid regions globally. While designed for climate science, it provides an unparalleled, high-quality, open-access dataset for regional geological mapping.
3.2. Airborne Systems
Airborne hyperspectral surveys remain the industry gold standard for detailed district-scale and prospect-scale exploration. Flying on fixed-wing aircraft or helicopters, these systems offer higher spatial resolution (typically 1 to 5 meters) and exceptional signal-to-noise ratios, allowing for the detection of subtle mineralogical variations.
- AVIRIS (Airborne Visible/Infrared Imaging Spectrometer): Developed by NASA JPL, AVIRIS is the grandfather of hyperspectral imaging and remains a benchmark for sensor performance and data quality.
- HyMap: A widely deployed commercial airborne sensor providing superior coverage and SNR in the SWIR, specifically tailored for the rigorous demands of mineral exploration applications.
3.3. Unmanned Aerial Vehicles (UAVs / Drones)
The miniaturization of optical components has catalyzed an explosion of drone-based hyperspectral surveys. UAV platforms equipped with micro-hyperspectral sensors (such as the Headwall Nano-Hyperspec or Specim AFX) can fly low and slow, yielding ultra-high spatial resolutions down to the centimeter scale. This is revolutionary for mapping previously inaccessible cliff faces, open-pit highwalls, and highly detailed local structural geology. UAV-based hyperspectral data successfully bridges the spatial gap between ground-based point sampling and traditional high-altitude airborne surveys.
3.4. Ground-Based and Automated Core Scanning
Hyperspectral imaging has moved beyond remote observation and directly into the core shack. Automated core scanning systems (like Corescan or Specim SisuROCK) can scan hundreds of meters of drill core per day. These systems generate sub-millimeter resolution mineral maps of the core, providing quantitative, objective, and continuous mineralogical logging that replaces inherently subjective visual logging by geologists. This highly granular data is fed directly into 3D block models for geometallurgy, mine planning, and resource estimation.

4. The Data Processing Pipeline: From Photons to Mineral Maps
Hyperspectral data is notoriously complex, highly dimensional, and voluminous. Transforming raw radiance data collected by the sensor into a map of geological meaning requires a rigorous, multi-step processing pipeline based on advanced mathematical and statistical algorithms.
4.1. Radiometric and Geometric Calibration
The raw data acquired by a sensor consists of digital numbers (DNs) representing the voltage recorded by the focal plane array. Radiometric calibration converts these DNs into physical units of at-sensor radiance (typically microwatts per square centimeter per steradian per nanometer). Geometric calibration orthorectifies the data, correcting for the platform's pitch, roll, yaw, and altitude variations, as well as topographic distortion using an underlying Digital Elevation Model (DEM).
4.2. Atmospheric Correction
The Earth's atmosphere scatters and absorbs electromagnetic radiation. Gases such as water vapor, carbon dioxide, and ozone create deep absorption features in the at-sensor radiance spectrum, severely masking the underlying mineral signatures. Atmospheric correction algorithms, such as FLAASH (Fast Line-of-sight Atmospheric Analysis of Hypercubes) or ATCOR, utilize complex Radiative Transfer Models (RTMs) like MODTRAN. These models simulate atmospheric conditions at the exact time of flight to strip away the atmospheric influence, mathematically converting at-sensor radiance into apparent surface reflectance. This is a critical step; without it, comparing image spectra to pristine laboratory spectral libraries is impossible.
4.3. Dimensionality Reduction
A hyperspectral image with 200 to 300 bands contains highly correlated data and a significant amount of sensor noise. Processing such high-dimensional data directly is computationally expensive and suffers from the "Hughes Phenomenon" (the curse of dimensionality). The Minimum Noise Fraction (MNF) transform is the standard technique used to solve this. Similar to Principal Component Analysis (PCA), MNF cascades two linear transformations to separate the coherent spatial signal from the random noise and compress the meaningful variance into a small number of bands (typically 10 to 20). This drastically reduces computational load while preserving the critical mineralogical variance.
4.4. Endmember Extraction
An "endmember" represents the pure spectral signature of a specific material (e.g., pure kaolinite or pure hematite) present within the image scene. Because the spatial resolution of satellite or airborne sensors means most pixels contain a sub-pixel mixture of materials (soil, rock, vegetation), finding the purest pixels is essential. Algorithms like the Pixel Purity Index (PPI) project the MNF-transformed data onto random n-dimensional vectors to identify the most extreme (purest) pixels in the dataset. Other automated geometric techniques like N-FINDR or Vertex Component Analysis (VCA) find the vertices of the data simplex in n-dimensional space, which mathematically correspond to the endmembers.
4.5. Spectral Matching and Mapping Algorithms
Once endmembers are extracted from the image (or selected from a reference library like the USGS Spectral Library), they must be mapped back onto the spatial image to show their distribution. Several robust algorithms are utilized:
- Spectral Angle Mapper (SAM): SAM treats both the reference spectrum and the image pixel spectrum as vectors in an n-dimensional space. It calculates the geometric angle between the two vectors. A smaller angle indicates a closer spectral match. SAM is highly robust against illumination variations caused by topography or shading, as the vector direction (spectral shape) is completely independent of vector length (albedo or overall brightness).
- Constrained Energy Minimization (CEM): CEM is an advanced target-detection algorithm that maximizes the response of a known target signature while simultaneously suppressing the response of the unknown background. It is highly effective for finding sub-pixel targets, rare minerals, or sparse outcrops in vegetated terrains.
- Spectral Feature Fitting (SFF): SFF isolates specific diagnostic absorption features (e.g., the 2200 nm Al-OH feature) by mathematically removing the continuum (the background hull of the spectrum). It then compares the depth, shape, and asymmetry of the continuum-removed absorption feature in the image pixel against the reference spectrum using a least-squares fit technique.
- Linear Spectral Unmixing (LSU): Because a single 30-meter satellite pixel may contain 30% kaolinite, 50% quartz, and 20% dry vegetation, LSU models the pixel spectrum as a linear combination of pure endmember spectra. The output is a series of abundance fraction maps, showing the estimated percentage of each mineral within every pixel.
5. Strategic Applications in the Mining Lifecycle
The utility of hyperspectral remote sensing for mineral exploration is not limited to simply finding outcropping rocks. It provides actionable intelligence across multiple phases of a modern mining project.
5.1. Grassroots Exploration and Alteration Vectoring
In the earliest stages of exploration, regional satellite or airborne hyperspectral data is used to identify and map zones of hydrothermal alteration. For porphyry copper systems, hyperspectral mapping can effectively delineate the classic Lowell and Guilbert alteration zoning: potassic, phyllic, argillic, and propylitic zones. By mapping the subtle compositional shifts in white micas (e.g., the shift of the 2200 nm Al-OH feature from 2190 nm in sodic paragonite to 2210 nm in potassic muscovite), geologists can establish temperature gradients and vector toward the magmatic heat source and the highest-grade ore shells.
5.2. Epithermal Gold and Silver Deposits
Epithermal systems are characterized by strong vertical and lateral zonation of clay and sulfate minerals. Hyperspectral remote sensing excels at differentiating low-sulfidation, intermediate-sulfidation, and high-sulfidation epithermal systems. The precise mapping of advanced argillic alteration (characterized by alunite, dickite, vuggy silica, and pyrophyllite) versus intermediate argillic alteration (smectite, illite) allows geologists to reconstruct the paleohydrothermal system and pinpoint the exact structural levels where boiling occurred and gold precipitated.
5.3. Geometallurgy and Mine Operations
As a project successfully moves from exploration into feasibility, development, and active operations, hyperspectral data transitions into a powerful geometallurgical tool. Knowledge of the alteration mineralogy is absolutely critical for predicting how the ore will behave in the processing plant. High concentrations of swelling clays (like smectite or montmorillonite) can drastically reduce the efficiency of crushing, grinding, and flotation circuits, while hard, intensely silicified zones exponentially increase energy consumption and wear on equipment. By integrating high-resolution hyperspectral core scanning data with 3D geological block models, mining engineers can confidently optimize blast designs, adjust blending strategies, and maximize metallurgical recovery rates.
5.4. Environmental Monitoring and Remediation
Hyperspectral imaging plays a vital, increasingly mandated role in environmental stewardship and mine closure. It is routinely used to map and monitor acid mine drainage (AMD) by identifying the secondary iron sulfate minerals (copiapite, schwertmannite, jarosite) that rapidly form when sulfide-rich waste rock is exposed to atmospheric oxygen and water. Because these specific minerals precipitate at varying pH levels, mapping them allows environmental engineers to track the source and severity of contamination. Also, drone-based hyperspectral surveys are utilized to monitor tailings storage facilities (TSFs), detecting subtle surface compositional changes and moisture content variations that could indicate structural instability or seepage.
6. Multispectral vs. Hyperspectral: Why the Leap is Necessary
While multispectral remote sensing has been a cornerstone of Earth observation since the launch of the Landsat program in the 1970s, its limitations in the context of detailed mineral exploration are profound. Multispectral sensors, such as Landsat 8 OLI or ASTER (Advanced Spaceborne Thermal Emission and Reflection Radiometer), capture data in a few, wide spectral bands.
For instance, ASTER, which was specifically designed with geological applications in mind, features only six bands in the critical SWIR region. While ASTER can successfully differentiate broad mineral groups, such as distinguishing argillic alteration from phyllic alteration based on generic absorption features, it fundamentally lacks the spectral resolution to pinpoint specific mineral species.
Consider the task of differentiating between kaolinite and dickite. Both are polymorphs of aluminum silicate and frequently occur in hydrothermal systems, yet they imply significantly different temperature regimes during formation (dickite indicating higher temperatures and closer proximity to the heat source). A multispectral sensor averages the reflectance over a broad wavelength range, effectively blurring the subtle, sharp absorption features at 2160 nm and 2200 nm that distinguish these two minerals. A hyperspectral sensor, recording data at 10 nm intervals or narrower, precisely captures the exact geometry, depth, and symmetry of the absorption doublet, allowing for unambiguous identification. The transition from multispectral to hyperspectral remote sensing for mineral exploration is akin to upgrading from a standard optical magnifying glass to an electron microscope; it shifts the entire paradigm from simple anomaly detection to precise, quantitative geochemical mapping.
7. Challenges and Future Frontiers
Despite its profound capabilities, hyperspectral remote sensing for mineral exploration faces several ongoing operational and physical challenges. The most significant of these is vegetation cover. In highly vegetated terrains (like the Amazon basin, Central Africa, or dense boreal forests), the optical canopy heavily obscures the underlying bedrock and soil. While advanced techniques like sub-pixel spectral unmixing can detect minute bare soil fractions, and biogeobotany (studying the chemical stress and pigment variations in vegetation caused by underlying heavy metal toxicity) shows immense promise, dense vegetation remains a fundamental physical limitation of all optical remote sensing technologies.
Also, the sheer volume of data produced by hyperspectral sensors historically required substantial computational power and highly specialized spectroscopic expertise. But this barrier is rapidly dissolving due to the advent of Cloud Computing and Artificial Intelligence (AI). The integration of Machine Learning (ML) and Deep Learning (DL) architectures, such as 1D and 3D Convolutional Neural Networks (CNNs), is automating the extraction of endmembers and the classification of complex mineral maps, significantly reducing processing time and the reliance on subjective human interpretation. Unlike traditional pixel-based classifiers like SAM, 3D CNNs evaluate not only the spectral signature of an individual pixel but also the spatial context of the surrounding pixels, mimicking the cognitive spatial reasoning of an experienced geologist.
The future of hyperspectral remote sensing is incredibly bright and highly dynamic. We are currently witnessing the dawn of hyperspectral microsatellite constellations, which will soon provide high-revisit frequency, consistent global coverage at unparalleled spatial resolutions. Combined with the rapid miniaturization of drone-mounted sensors and the power of AI-driven data fusion (smoothly combining hyperspectral data with LiDAR, magnetics, radiometrics, and gravity datasets), the mining industry is aggressively moving towards a fully integrated, multi-dimensional, and highly predictive exploration paradigm.
8. Conclusion
The integration of hyperspectral remote sensing for mineral exploration represents a monumental major shift in the geosciences. By transitioning from qualitative visual field observations to quantitative, laboratory-grade optical spectroscopy conducted at the landscape and district scale, exploration teams can significantly reduce risk, rapidly optimize drill targeting, and discover the deep, hidden deposits that are absolutely essential for sustaining the modern world's technological advancement. As sensor hardware becomes more advanced, acquisition platforms more accessible, and processing algorithms more intelligent through AI, hyperspectral imaging will undoubtedly solidify and expand its position as the premier remote reconnaissance, vectoring, and geometallurgical tool in the modern geoscientist's toolkit.
Frequently Asked Questions
What makes hyperspectral imaging useful for mineral exploration?
Hyperspectral sensors capture hundreds of continuous, narrow bands of light across the visible and infrared spectrums. Because every mineral reflects light in a unique, highly specific spectral 'fingerprint', hyperspectral data can map surface geology from space.
Which wavelengths are most important for detecting minerals?
The Shortwave Infrared (SWIR) region (roughly 1400 to 2500 nm) is critical for mineral exploration because many alteration minerals associated with valuable ore deposits (like clays, carbonates, and sulfates) have distinct absorption features in this range.
Can satellites find underground gold or copper?
Satellites cannot see underground. However, they can map hydrothermal alteration zones, specific surface rock patterns and mineral assemblages that were formed by superheated fluids, which act as strong indicators that precious metals lie beneath the surface.
