Google Earth Engine Water Quality Monitoring
Table of Contents
- The Core Mechanics of Remote Sensing in Hydrology
- Utilizing Google Earth Engine for Large-Scale Analysis
- Leveraging the Landsat and Sentinel Constellations
- Sentinel-2 Multispectral Instrument (MSI) Capabilities
- Landsat 8 and 9 Operational Land Imagers
- Creating Cloud-Free Composites
- Mapping Key Indicators: Turbidity and Chlorophyll
- Algorithms for Total Suspended Matter (TSM)
- Chlorophyll-a Concentration Estimation
- Developing Regional Empirical Models
- The Role of Machine Learning in Parameter Retrieval
- Neural Networks for Non-Linear Spectral Relationships
- Random Forest Classifiers for Bloom Detection
- Validating with In-Situ Data
- Future Trajectories of Open Source Hydrological Mapping
- Frequently Asked Questions
rsandgis.me
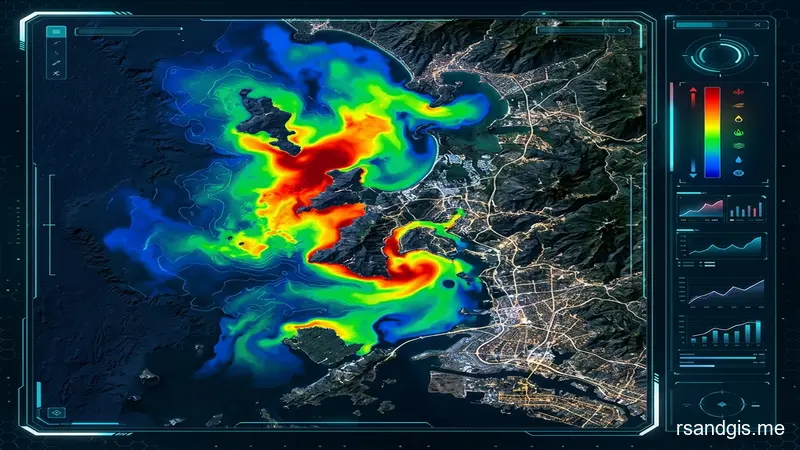
The advent of google earth engine water quality monitoring has fundamentally transformed how we observe our planet's inland and coastal aquatic ecosystems. As climate change accelerates and anthropogenic pressures on freshwater resources mount, the traditional method of relying solely on sparse, expensive in-situ sampling is no longer sufficient. We need continuous, high-resolution, and large-scale observation capabilities. Enter cloud-based geospatial processing and advanced satellite constellations, which have democratized access to planetary-scale hydrological data. This guide explores the sophisticated methodologies used to extract critical aquatic parameters, such as turbidity, chlorophyll-a, and colored dissolved organic matter (CDOM), from multi-spectral optical imagery using modern cloud infrastructure.
Historically, remote sensing of aquatic environments was a niche discipline fraught with challenges. Water is a highly dynamic medium that absorbs a significant portion of incoming solar radiation, resulting in a very weak signal reaching the satellite sensor compared to terrestrial surfaces. This weak signal is further compounded by atmospheric scattering, sun glint, and adjacency effects from nearby land masses. Overcoming these obstacles required downloading massive datasets, performing complex atmospheric corrections on local high-performance computing clusters, and spending weeks tuning empirical algorithms. Today, cloud platforms have entirely circumvented the data download bottleneck, providing instant access to petabytes of analysis-ready data.
The true power of this technological convergence lies in its scalability. A workflow designed to assess the eutrophication of a single local lake can now be effortlessly scaled to monitor thousands of lakes across an entire continent with just a few modifications to the underlying code. This capability is vital for environmental protection agencies, water resource managers, and conservation organizations striving to meet international water standards and protect vulnerable ecosystems from harmful algal blooms and industrial runoff.
The Core Mechanics of Remote Sensing in Hydrology
To fully grasp the potential of these platforms, one must first understand the fundamental physics of how light interacts with the water column. When sunlight strikes a body of water, several phenomena occur: reflection at the surface, absorption by the water molecules and dissolved substances, and scattering by suspended particles. The optical properties of the water body, specifically its Inherent Optical Properties (IOPs) such as the absorption coefficient and backscattering coefficient, dictate the color and intensity of the light that is ultimately reflected back up towards space, known as the water-leaving radiance.
Aquatic environments are generally classified into two optical types. Case 1 waters, typically open oceans, have optical properties dominated by phytoplankton and their immediate byproducts. Case 2 waters, encompassing most coastal zones, estuaries, and inland lakes, are significantly more complex. Their optical signatures are influenced by an independent mixture of phytoplankton, suspended inorganic sediments, and dissolved organic matter. Monitoring Case 2 waters requires sensors with high spectral resolution and algorithms capable of unmixing these overlapping spectral signatures.
The primary parameters retrieved via remote sensing are Chlorophyll-a (Chl-a), which acts as a proxy for phytoplankton biomass and nutrient enrichment; Total Suspended Matter (TSM) or turbidity, which indicates sediment load and erosion; and Colored Dissolved Organic Matter (CDOM), which relates to the carbon cycle and terrestrial runoff. By measuring the reflectance at specific wavelengths, typically in the blue, green, red, and near-infrared (NIR) bands, scientists can utilize established band-ratio algorithms or semi-analytical models to estimate the concentrations of these constituents with remarkable accuracy.
Utilizing Google Earth Engine for Large-Scale Analysis
The primary barrier to large-scale aquatic monitoring has always been computational constraint. Processing years of high-resolution satellite imagery across vast geographical extents is computationally prohibitive for standard desktop hardware. This paradigm shifted dramatically with the introduction of cloud-based geospatial processing platforms, which co-locate massive data archives with immense, parallelized computing power. Users can execute complex algorithms across thousands of images simultaneously, generating time-series charts and spatial maps in a matter of seconds.
The architecture of these platforms allows users to write scripts in JavaScript or Python via an API, sending the instructions to the cloud servers where the actual processing occurs. This "code-to-data" approach eliminates the need to download large imagery tiles. Also, the platform's extensive data catalog includes pre-processed, atmospherically corrected surface reflectance datasets, saving researchers countless hours of complex pre-processing work. For aquatic applications, selecting the right atmospheric correction method (such as ACOLITE or Sen2Cor) is critical, as the atmospheric path radiance can account for over 90% of the signal measured by the satellite.
Leveraging the Landsat and Sentinel Constellations
The success of any monitoring initiative relies entirely on the quality and temporal frequency of the underlying imagery. The two most prominent open-access satellite constellations utilized for this purpose are the joint NASA/USGS Landsat program and the European Space Agency's (ESA) Copernicus Sentinel program. Both provide global coverage and freely accessible data archives, but they possess distinct characteristics that dictate their respective use cases.
Sentinel-2 Multispectral Instrument (MSI) Capabilities
The Sentinel-2 mission comprises twin satellites flying in the same orbit, phased 180 degrees apart. They carry the Multispectral Instrument (MSI), which offers unparalleled capabilities for inland and coastal monitoring. Sentinel-2 boasts a high spatial resolution of up to 10 meters in the visible and near-infrared bands, allowing for the observation of relatively small lakes and narrow river channels. Its rapid revisit time of just 5 days at the equator (and even more frequently at higher latitudes) is crucial for capturing highly dynamic aquatic events, such as the rapid onset of a harmful algal bloom following a heavy rainfall event.
Landsat 8 and 9 Operational Land Imagers
The Landsat program provides an unparalleled historical archive, stretching back over four decades. Landsat 8 and 9, equipped with the Operational Land Imager (OLI), offer a spatial resolution of 30 meters. While coarser than Sentinel-2, the OLI features improved signal-to-noise ratios and a highly sensitive deep blue band (Band 1, 0.43-0.45 micrometers) specifically designed for coastal and aerosol studies. The deep blue band is exceptionally useful for detecting CDOM and differentiating between subtle variations in water color. When the data from Landsat 8/9 and Sentinel-2 are harmonized, researchers can achieve a near-daily revisit time, creating a dense, robust time-series for continuous monitoring.
Creating Cloud-Free Composites
One of the persistent challenges in optical remote sensing is cloud cover. In many tropical and temperate regions, obtaining a completely cloud-free image of a specific water body is rare. Cloud-based platforms address this issue by allowing users to easily generate temporal composites. By analyzing a stack of images acquired over a specific period (e.g., a month or a season), algorithms can identify and mask out clouds, cloud shadows, and sun glint on a pixel-by-pixel basis. The remaining clear pixels are then aggregated using median or percentile reducers to create a seamless, cloud-free representation of the water body's typical state during that time frame.
Mapping Key Indicators: Turbidity and Chlorophyll
Once a clean, atmospherically corrected image collection is prepared, the next step involves applying specific bio-optical algorithms to convert the spectral reflectance values into quantifiable water quality metrics. These algorithms range from simple empirical band ratios to complex, physics-based semi-analytical models.
Algorithms for Total Suspended Matter (TSM)
Total Suspended Matter (TSM) is highly correlated with turbidity and water clarity. As the concentration of suspended sediments increases, the water reflects more light, particularly in the red and near-infrared (NIR) portions of the electromagnetic spectrum. A common and robust approach for estimating TSM involves utilizing the reflectance in the red band (around 660 nm). As sediment concentrations become extremely high, the red band may saturate, and algorithms must dynamically switch to using the NIR band (around 850 nm) to maintain accuracy.
Chlorophyll-a Concentration Estimation
Chlorophyll-a is the primary photosynthetic pigment in phytoplankton and is the standard metric for assessing aquatic eutrophication. In clear, open-ocean waters, standard blue-green ratio algorithms (like the OC4 algorithm) perform exceptionally well. These rely on the principle that chlorophyll strongly absorbs blue light and reflects green light. But in complex inland waters, CDOM and suspended sediments also strongly absorb blue light, rendering these standard algorithms ineffective.
Developing Regional Empirical Models
To accurately map chlorophyll in inland waters, researchers typically rely on the red and near-infrared spectral regions, where the influence of CDOM and suspended sediments is minimized. The most common algorithms utilize the red-edge band (around 705 nm) available on Sentinel-2. Phytoplankton exhibit a distinct absorption peak at 665 nm and a scattering peak at 705 nm. The ratio of the reflectance at 705 nm to 665 nm (the two-band NIR-Red ratio) or more complex three-band models correlate strongly with chlorophyll-a concentration. Because optical properties vary geographically, these empirical models must be calibrated and validated using regional in-situ sampling data to ensure high accuracy.
The Role of Machine Learning in Parameter Retrieval
As computational power increases and algorithms evolve, the field is rapidly moving beyond simple empirical band ratios toward the application of advanced Machine Learning (ML) techniques. ML models excel at unraveling the complex, non-linear relationships inherent in the optical signatures of mixed Case 2 waters.
Neural Networks for Non-Linear Spectral Relationships
Artificial Neural Networks (ANNs) and deep learning architectures are increasingly being trained to ingest the entire multi-spectral signature of a pixel and simultaneously output concentrations of multiple parameters (Chl-a, TSM, and CDOM). These networks are typically trained on massive datasets generated by radiative transfer models (like Hydrolight) or extensive global in-situ databases. Once trained, they can be deployed within cloud processing pipelines to rapidly generate highly accurate, simultaneous multi-parameter maps, dynamically adapting to different water types without the need for manual algorithm switching.
Random Forest Classifiers for Bloom Detection
In addition to quantifying concentrations, ML is extensively used for the categorical classification of water states, particularly in the rapid detection of Harmful Algal Blooms (HABs). Random Forest and Support Vector Machine (SVM) algorithms can be trained to recognize the specific spectral anomalies associated with intense cyanobacteria blooms. By classifying pixels as either "clear water," "moderate bloom," or "severe bloom," automated alert systems can be developed to notify local authorities immediately when a bloom is detected near a drinking water intake or a popular recreational beach.
Validating with In-Situ Data
Regardless of the sophistication of the algorithm, whether a simple band ratio or a complex deep learning neural network, rigorous validation against coincident in-situ measurements remains absolutely paramount. Satellite sensors measure the optical signal at the very top of the atmosphere, and any errors in atmospheric correction, sensor calibration, or algorithmic assumptions will propagate into the final water quality map. Continuous field sampling programs, utilizing autonomous buoys or manual boat surveys equipped with spectrophotometers and fluorometers, provide the ground truth data necessary to calibrate the models, assess their uncertainty, and build trust in the remote sensing products.
Future Trajectories of Open Source Hydrological Mapping
The future of aquatic remote sensing is exceptionally promising, driven by the convergence of increasingly capable satellite hardware and exponentially expanding cloud computing resources. The upcoming launches of next-generation hyperspectral missions, such as NASA's PACE (Plankton, Aerosol, Cloud, ocean Ecosystem) and ESA's CHIME (Copernicus Hyperspectral Imaging Mission for the Environment), will provide continuous spectral data across hundreds of narrow bands. This hyperspectral capability will allow scientists to not only quantify phytoplankton biomass but to definitively identify specific species and track the intricate dynamics of the aquatic carbon cycle.
Also, the integration of physical biogeochemical models with satellite observations via data assimilation will create predictive forecasting systems. Much like modern weather forecasting, these systems will provide early warnings for harmful algal blooms, hypoxic events, and sediment plumes, shifting water resource management from a reactive posture to a proactive, highly informed discipline. As these tools become more user-friendly and widely accessible, the global community will be better equipped to monitor, protect, and sustainably manage our planet's most precious resource.
Frequently Asked Questions
How does Google Earth Engine monitor water quality?
Google Earth Engine (GEE) processes massive satellite datasets (like Landsat and Sentinel) to analyze spectral reflectance, allowing researchers to estimate water quality parameters like turbidity and chlorophyll-a remotely.
What is chlorophyll-a mapping in remote sensing?
Chlorophyll-a mapping uses specific satellite bands (usually green and near-infrared) to detect the presence of algae and phytoplankton, serving as a primary indicator of water body eutrophication.
Which satellite is best for water quality monitoring?
Sentinel-2 is widely considered the best open-access satellite for water quality monitoring due to its high spatial resolution (10m) and specific coastal/aerosol spectral bands.
