GRASS GIS Python Automation Guide
Table of Contents
- Introduction: Unlocking the Power of Location Data
- 1. The True Meaning of GIS: Beyond Digital Maps
- 2. How GIS Works: The Science of Layering Data
- 3. The Five Core Components of a GIS
- A. Hardware
- B. Software
- C. Data
- D. Methods (Procedures)
- E. People
- 4. Understanding GIS Data: Vector vs. Raster
- Vector Data
- Raster Data
- 5. The Magic of GIS: Spatial Analysis
- A. Proximity Analysis
- B. Overlay Analysis
- C. Network Analysis
- D. Spatial Interpolation
- 6. Real-World Applications of GIS Across Industries
- Urban Planning and Government
- Environmental Management and Conservation
- Public Health and Epidemiology
- Business, Retail, and Marketing
- Emergency Management and Disaster Response
- 7. The Future of GIS: Where Are We Heading?
- A. Integration with Artificial Intelligence (GeoAI)
- B. Web GIS and Cloud Computing
- C. 3D GIS and Digital Twins
- D. Real-Time GIS and the Internet of Things (IoT)
- Conclusion: The Indispensable Role of Location Intelligence
- Frequently Asked Questions
rsandgis.me
Mastering GRASS GIS Python automation is the key to unlocking the true power of open-source geoprocessing and scalable spatial analytics. While the graphical user interface provides an excellent way to learn the system, professional geospatial data scientists rely entirely on Python to build automated, headless, and repeatable workflows. By replacing manual clicks with programmatic instructions, you can process terabytes of raster imagery, perform complex topological vector operations, and integrate directly with external Python libraries like NumPy and Pandas.
In this comprehensive guide, we will explore the deepest technical layers of the PyGRASS API, the native grass.script library, and the exact methodologies required to construct enterprise-grade spatial data pipelines. We will cover environment configuration, advanced map algebra, hydrological flow accumulation, topological vector cleaning, and the deployment of headless GRASS instances using Docker and Kubernetes. By the end of this masterclass, you will possess the foundational knowledge required to orchestrate massive Earth observation datasets entirely through code.
The transition from desktop GIS to automated cloud-native spatial processing is no longer a luxury; it is a strict requirement for modern environmental monitoring, precision agriculture, and urban planning. As satellite constellations like Sentinel and Landsat beam down petabytes of imagery every single day, the traditional paradigm of manually loading TIFF files into a desktop canvas has completely broken down. Automation is the only path forward, and GRASS GIS, with its battle-tested C-backend and elegant Python wrapper, stands as one of the most capable tools for the job.
Understanding the PyGRASS Architecture
The transition from desktop clicking to GRASS GIS Python automation requires a fundamental shift in how you understand the software's architecture. At its core, GRASS is a collection of hundreds of independent C-compiled modules. The Python API (often called PyGRASS or simply the grass.script library) acts as a high-level wrapper around these incredibly fast C binaries. This means that when you write a Python script to execute a GRASS module, you are getting the rapid execution speed of C with the syntactic elegance of Python.
There are two primary paradigms when writing Python code for GRASS GIS. The first is the classic grass.script module, which essentially acts as a subprocess wrapper. When you call grass.script.run_command('r.mapcalc', expression='ndvi = (nir - red) / (nir + red)'), the Python library spawns a new process, passes the arguments to the C binary, waits for the execution to finish, and returns the exit code. This approach is highly stable, heavily documented, and represents the easiest way to translate GUI workflows into bash or Python scripts.
The second, more modern approach is the pygrass object-oriented API. Introduced in GRASS GIS 7, PyGRASS was designed to provide a more Pythonic interface to the underlying C libraries. Instead of spawning subprocesses, PyGRASS interacts directly with the GRASS C API via ctypes. This allows for significantly faster execution times, especially when iterating over millions of vector features or reading specific raster pixels directly into memory. Using PyGRASS, a vector map is not just a file on disk; it is an instantiated Python object with methods like .open(), .read(), and .close().
Choosing between grass.script and pygrass depends entirely on your workflow. For batch processing hundreds of rasters using standard GRASS tools, grass.script is often sufficient and easier to implement. However, if you need to build custom algorithms that iterate over pixel arrays, read geometries into memory for custom calculations, or interface directly with Shapely and GeoPandas, the object-oriented PyGRASS API is the superior choice.
Setting Up the Python Environment
One of the most notorious hurdles in GRASS GIS Python automation is properly configuring the environmental variables. Unlike a standard pip-installable library, PyGRASS requires an active GRASS "session" to function. The library needs to know where the spatial database (the GISDBASE), the Location, and the Mapset are located on your hard drive. Furthermore, it must be able to locate the compiled C libraries in your system path.
When running a script from inside the QGIS or GRASS GUI Python console, these variables are already initialized. However, true automation demands headless execution from a standard command prompt or cron job. To achieve this, you must construct a robust startup script that dynamically sets the GISBASE, LD_LIBRARY_PATH (on Linux) or PATH (on Windows), and the PYTHONPATH.
A typical initialization block utilizes the grass.script.setup module. First, you define the path to your GRASS installation directory. Then, you define the path to your specific project Mapset. The setup.init() function is then called, which mounts the spatial database and allows all subsequent module calls to read and write data to that specific directory. Failure to initialize this session correctly is the number one cause of ModuleNotFoundError and segmentation faults in automated pipelines.
For modern deployments, utilizing virtual environments like Conda or standard Python venvs is highly recommended. By isolating your GRASS installation alongside specific versions of GDAL, PROJ, and GEOS, you prevent systemic dependency conflicts. Organizations deploying enterprise solutions often construct highly customized Dockerfiles that pre-compile GRASS from source, inject the necessary environmental paths into the `.bashrc`, and expose the Python interpreter via JupyterLab or FastAPI endpoints.
Advanced Raster Processing Automation
When diving deeper into GRASS GIS Python automation, raster processing becomes the primary focus. GRASS was originally designed by the U.S. Army Construction Engineering Research Laboratory (CERL) specifically for massive raster land-management analysis. Its raster engine is legendary for its speed and ability to handle datasets that vastly exceed available system RAM.
Automating raster workflows typically begins with data ingestion. Using grass.script.run_command('r.import', input='dem.tif', output='elevation'), you can programmatically suck thousands of GeoTIFFs into the native GRASS binary format. Once ingested, the true power of map algebra is unlocked. The r.mapcalc module allows you to execute complex mathematical equations across multiple grids simultaneously. For instance, calculating a customized drought index based on thermal and multispectral bands can be executed in a single line of Python code.
Furthermore, automating GRASS GIS via Python enables batch processing of massive Earth observation datasets. Consider a scenario where you must calculate the Normalized Difference Vegetation Index (NDVI) for 500 individual Sentinel-2 satellite tiles. Doing this manually would take weeks of tedious, error-prone clicking. With a simple Python loop, you can process the entire directory in a matter of hours. The script sequentially imports the bands, executes the map algebra, and exports the final raster without any human intervention.
GRASS also excels in focal and neighborhood operations. Modules like r.neighbors allow you to pass moving windows (e.g., 3x3 or 5x5 matrices) across a grid to calculate averages, medians, or standard deviations. By automating these smoothing operations via Python, you can dynamically build image pyramids or filter out high-frequency noise from raw satellite imagery before feeding the data into a machine learning classification model.
Hydrological Modeling Workflows
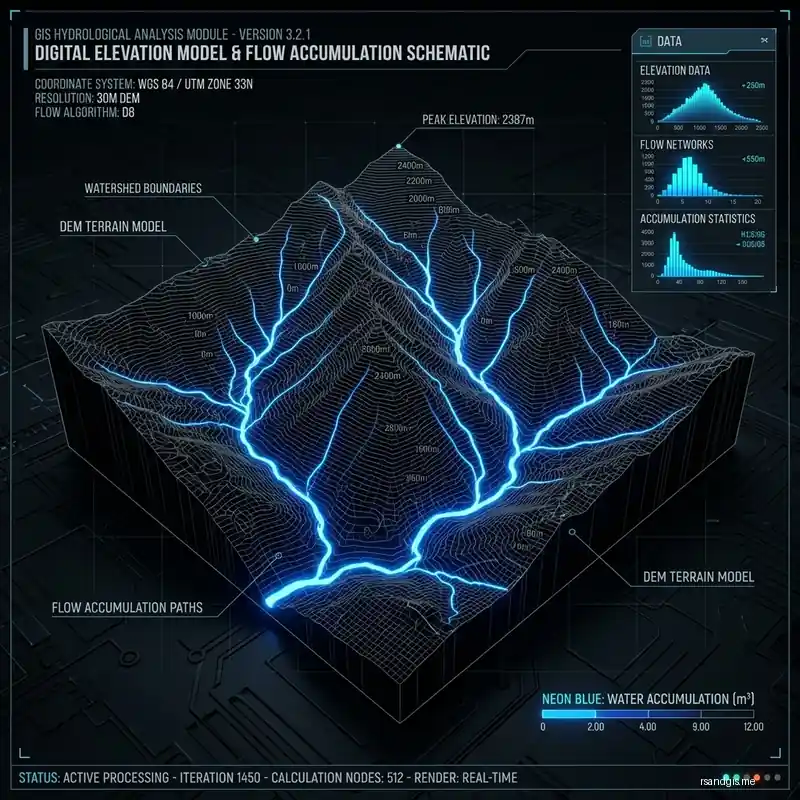
Perhaps the most celebrated use-case for GRASS GIS Python automation is hydrological modeling. Modules like r.watershed and r.terraflow represent some of the most sophisticated terrain analysis algorithms available in the open-source ecosystem. Automating these tools allows hydrologists to delineate massive river basins, calculate flow direction, and model flood inundation scenarios at continental scales.
A standard automated hydrological pipeline begins by importing a raw Digital Elevation Model (DEM). The Python script first executes r.fill.dir to identify and fill localized depressions or "sinks" in the terrain that would otherwise trap digital water flow. Next, the script triggers r.watershed, passing the filled DEM as an input. This powerhouse module utilizes a least-cost-path algorithm to calculate the accumulation of flow across every single pixel, outputting stream networks, watershed basins, and topographic wetness indices.
The beauty of wrapping this in Python is the ability to iterate. If a researcher needs to test how different sea-level rise scenarios or varying rainfall intensities affect a watershed, they simply loop the script over a parameter grid. The script can automatically adjust the input variables, run the massive r.watershed calculation, export the resulting flood maps to GeoJSON, and upload them directly to a PostGIS database for web visualization.
Additionally, GRASS provides extensive tools for groundwater modeling. By combining r.gwflow with Python's SciPy library, analysts can construct transient, two-dimensional groundwater flow models. The Python layer handles the temporal boundary conditions—injecting new pumping rates or recharge values for each time step—while the GRASS C-backend solves the complex partial differential equations at breakneck speeds.
Topological Vector Processing
While rasters often steal the spotlight, GRASS GIS possesses a strictly topological vector engine that is fundamentally different from the "spaghetti" model used by shapefiles and GeoJSONs. In a topological system, boundaries are shared. If two land parcels touch, they share a single line segment, not two overlapping lines. This mathematically eliminates topological errors like slivers and gaps.
Automating vector operations in GRASS ensures data integrity. When you write a Python script to import municipal zoning shapefiles using v.import, GRASS automatically snaps nodes, breaks intersecting lines, and builds a clean topological network. You can programmatically control the snapping threshold, allowing the script to automatically clean messy CAD drawings or digitized field data before it enters your enterprise database.
The PyGRASS API is particularly potent here. Using the VectorTopo class, Python developers can directly iterate over points, lines, and boundaries. You can query the database to find all polygons adjacent to a specific feature, calculate the total length of shared borders, or perform advanced network routing algorithms using the v.net suite of modules. Solving the Traveling Salesman Problem or calculating isochrone drive-time maps can be executed entirely via headless Python scripts.
Integrating with Scikit-Learn and ML
Another critical aspect of GRASS GIS Python automation is its ability to seamlessly integrate with the broader Python data science ecosystem. By leveraging the PyGRASS API, users can directly export raster layers into NumPy arrays. This direct memory access circumvents the need for writing intermediate TIFFs to disk, drastically reducing I/O bottleneck operations.
Once the raster data resides in a NumPy array, analysts can apply advanced machine learning algorithms from Scikit-Learn, TensorFlow, or PyTorch. A common automated workflow involves extracting spectral signatures from a stack of Landsat bands (stored in GRASS), formatting them into a multidimensional NumPy array, and training a Random Forest classifier. The trained model then predicts the land-cover class for every pixel.
Crucially, the resulting NumPy array containing the predictions can be instantly pushed back into the GRASS spatial database using the RasterRow object methods. This creates a closed-loop system: data storage and spatial querying are handled by GRASS, while predictive modeling is handled by Scikit-Learn, all orchestrated by a single Python script.
Headless Execution and Docker Deployments
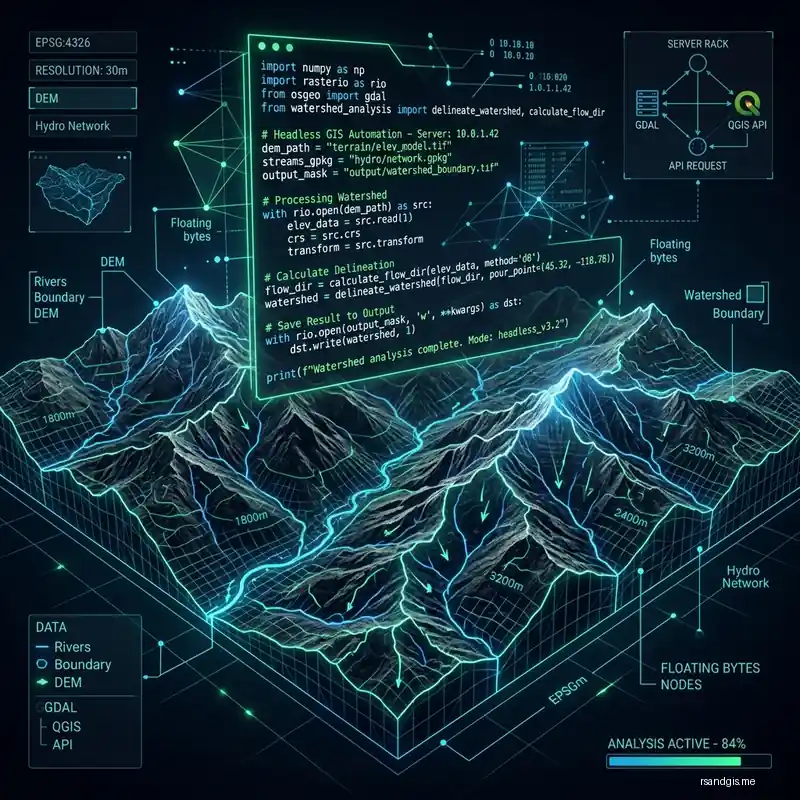
One of the most powerful aspects of GRASS GIS Python automation is the ability to run the software in a completely headless state. This means executing operations without ever opening the GUI or initializing the X-server on a Linux machine. Headless execution is the cornerstone of modern WebGIS architecture.
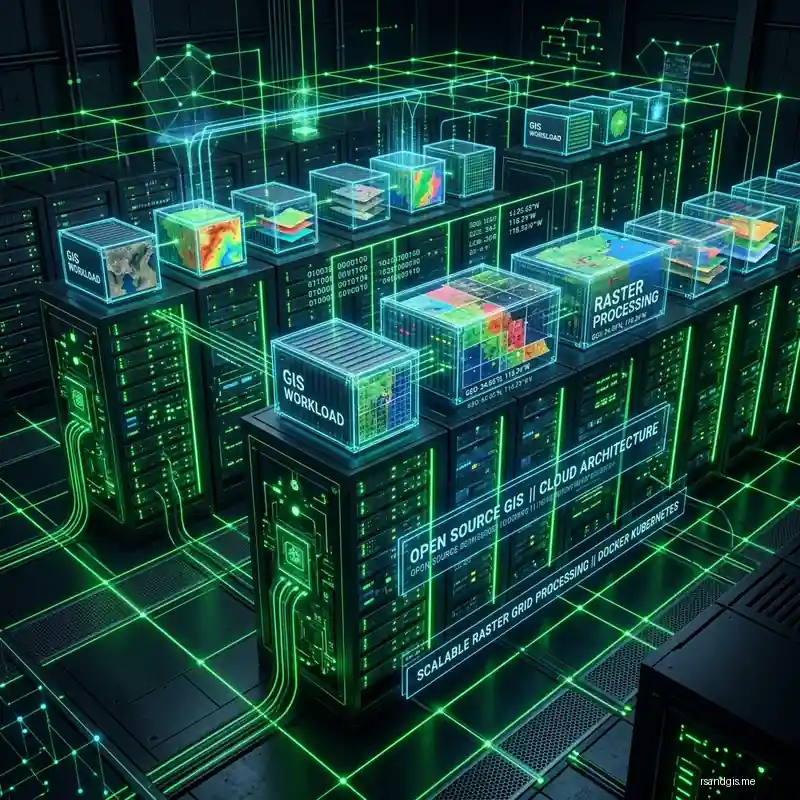
By packaging your GRASS Python geoprocessing scripts into Docker containers, you can scale your analysis across cloud computing platforms like AWS EC2, Google Cloud Run, or Azure Kubernetes Service. A standard deployment involves creating an Ubuntu-based Docker image, installing the grass-core binaries via apt, and setting up a lightweight Flask or FastAPI server.
When a user clicks a button on a web dashboard to "Calculate Watershed", the frontend sends a GeoJSON coordinate to the FastAPI endpoint. The API triggers the Python script, which dynamically creates a temporary GRASS Mapset, downloads the relevant DEM tile from an AWS S3 bucket, runs r.watershed, and streams the resulting vector polygons directly back to the user's browser. The container then destroys the temporary Mapset, ensuring a stateless, infinitely scalable architecture.
Error Handling and Enterprise Logging
When constructing robust geoprocessing pipelines, error handling and logging become paramount. Unlike GUI operations which might crash silently or throw a cryptic popup, Python automation allows developers to wrap their GRASS module calls in standard try-except blocks.
By catching specific CalledProcessError exceptions emitted by the grass.script library, you can programmatically dictate whether your pipeline should halt execution, retry the operation with a different snapping tolerance, or log the failure to an external monitoring system like AWS CloudWatch or Datadog. You can also parse the stderr output from the C modules to extract specific warning messages.
This robust programmatic control transforms GRASS from a desktop application into enterprise-grade middleware. Combining Python's native logging module with GRASS execution allows you to track processing times, monitor memory consumption, and guarantee the traceability of your spatial algorithms from ingestion to final map rendering.
2. How GIS Works: The Science of Layering Data
To grasp the basics of how a Geographic Information System functions, it is helpful to visualize it as a sophisticated digital sandwich. Unlike traditional paper maps that flatten all information into a single, static image, GIS technology organizes different types of geographic information into distinct, independent layers.
Each layer represents a specific category of geographic or attribute data. For example, a city's GIS model might consist of the following data layers:
- Base Map Layer: High-resolution satellite imagery or a topological map serving as the foundational background.
- Street Network Layer: All roads, highways, and paths, often containing routing and speed limit data.
- Zoning Layer: Polygons detailing commercial, residential, and industrial zones.
- Utility Infrastructure Layer: Lines and points representing water pipes, electrical grids, and sewer systems.
- Demographic Layer: Census data showing population density, income levels, and age distribution.
By selectively stacking, viewing, and comparing these layers, GIS professionals can perform complex spatial analysis. For instance, a city planner could overlay the demographic layer (showing high-density populations of elderly citizens) with the utility layer (showing public transportation routes) and a healthcare layer (showing hospital locations) to determine if medical services are adequately accessible to the most vulnerable populations.
3. The Five Core Components of a GIS
A fully functioning Geographic Information System is not merely a software program you install on a computer. It is a holistic ecosystem comprised of five critical, interdependent components. Without any one of these pillars, the system cannot function at its full potential.
A. Hardware
Hardware is the physical equipment on which a GIS operates. Historically, GIS required massive, specialized mainframe computers. Today, the landscape has evolved significantly. GIS software can run on a wide spectrum of hardware, ranging from high-performance desktop workstations and dedicated enterprise servers to cloud computing networks and even mobile smartphones and tablets used for field data collection.
B. Software
GIS software provides the graphical user interface (GUI) and the underlying analytical tools needed to input, store, analyze, and display spatial data. Industry-leading proprietary software includes Esri's ArcGIS suite, which dominates the enterprise market. However, robust open-source alternatives like QGIS (Quantum GIS) have gained immense popularity, offering powerful geospatial capabilities without the prohibitive licensing costs. Key software components include database management systems (DBMS), graphical rendering engines, and geoprocessing toolboxes.
C. Data
Data is arguably the most crucial and expensive component of any GIS project. Without accurate, up-to-date data, the system is useless, a concept known as "garbage in, garbage out." GIS relies on the seamless integration of spatial data (the geometric representation of features) and tabular attribute data (the descriptive information about those features). Data can be sourced from satellite imagery, aerial surveys, GPS field data collection, digitized paper maps, and massive governmental or commercial databases.
D. Methods (Procedures)
A successful GIS operates according to well-designed plans, business rules, and analytical models, which are unique to each organization. Methods refer to the standardized procedures and workflows established to ensure data quality, analytical consistency, and operational efficiency. This includes protocols for data entry, quality assurance (QA) checks, update frequencies, and specific spatial analysis methodologies tailored to the organization's overarching goals.
E. People
GIS technology is only as effective as the people who manage and use it. The human element ranges from highly trained GIS specialists, spatial data scientists, and cartographers who design and maintain the system, to the end-users (like city planners, logistics managers, and environmental researchers) who utilize the final maps and analytical outputs to make informed, strategic decisions.
4. Understanding GIS Data: Vector vs. Raster
In the realm of GIS, geographic data is fundamentally categorized into two primary spatial data models: Vector and Raster. Understanding the distinction between these two formats is essential for anyone diving into the basics of geospatial analysis.
Vector Data
Vector data represents the world using distinct geometric shapes based on mathematical coordinates (X and Y). It is ideal for defining features with clear, discrete boundaries. Vector data is broken down into three geometric types:
- Points: Used to represent distinct, zero-dimensional locations where the exact shape is not relevant at the given scale. Examples include light poles, individual trees, well locations, or specific addresses.
- Lines (Arcs): One-dimensional features representing linear entities that have length but no area. Examples include roads, rivers, contour lines, and utility pipelines.
- Polygons: Two-dimensional enclosed areas representing features that have both perimeter and geographic area. Examples include property parcels, country borders, lakes, and zoning districts.
Vector data is highly scalable and maintains crisp edges regardless of how much you zoom in, making it perfect for precise mapping and detailed spatial queries.
Raster Data
Raster data, on the other hand, represents the world as a continuous grid of equally sized cells or pixels. Each pixel holds a specific numeric value representing the condition of the geographic area covered by that cell. Raster data is perfectly suited for modeling continuous phenomena that lack clear boundaries.
Common examples of raster data include:
- Satellite Imagery and Aerial Photography: Where each pixel represents a color value reflecting the light off the Earth's surface.
- Digital Elevation Models (DEMs): Where each pixel contains a specific elevation value, allowing for 3D terrain modeling and slope analysis.
- Temperature and Precipitation Maps: Where pixel values represent climatic measurements interpolated across a vast area.
While raster data is excellent for continuous surface analysis, it can consume massive amounts of computer storage space, and its resolution is strictly limited by the size of its individual pixels.
5. The Magic of GIS: Spatial Analysis
The true power of GIS lies not just in making pretty maps, but in spatial analysis. This is the process of extracting or creating new information from spatial data to solve complex problems, evaluate suitability, and predict future outcomes. Some of the core analytical functions of GIS include:
A. Proximity Analysis
Answering questions about what is near what. Buffering is a classic proximity tool. For example, a city might create a 500-foot buffer zone around all local schools to mandate drug-free or alcohol-free zones, instantly identifying which commercial properties fall within that restricted perimeter.
B. Overlay Analysis
The process of superimposing multiple data layers to find intersections or overlapping criteria. For example, an agricultural company looking for optimal farmland might overlay layers containing soil quality, average rainfall, and land slope to pinpoint the exact geographic regions that meet all three conditions for a specific crop.
C. Network Analysis
Analyzing routing and connectivity along linear networks (like roads or pipes). Logistics companies like UPS and FedEx rely heavily on GIS network analysis to optimize complex delivery routes, minimizing travel time and fuel consumption while factoring in one-way streets, speed limits, and historical traffic patterns.
D. Spatial Interpolation
Estimating values for unknown areas based on known data points. If you have pollution sensors scattered across a city, GIS can use interpolation algorithms to predict and map the estimated pollution levels for the entire urban area, creating a continuous heat map from discrete point data.
6. Real-World Applications of GIS Across Industries
Because nearly all human activity has a geographic component, the applications of GIS are virtually limitless. It has become a mission-critical technology across both the public and private sectors. Here is a look at how GIS is transforming various industries:
Urban Planning and Government
Municipal governments are among the largest users of GIS. Planners use it for zoning, tracking property tax parcels, designing new infrastructure, and managing public utilities. GIS allows city officials to model the potential impact of new developments, such as how a new shopping mall might affect local traffic congestion or emergency response times.
Environmental Management and Conservation
Environmental scientists rely heavily on GIS to monitor ecosystems, track wildlife migration patterns, manage natural resources, and model the impacts of climate change. GIS is instrumental in analyzing deforestation via satellite imagery, planning sustainable forestry operations, and assessing the environmental impact of proposed construction projects.
Public Health and Epidemiology
The field of public health utilizes GIS to track the spread of infectious diseases, identify health trends, and allocate medical resources efficiently. During the COVID-19 pandemic, GIS dashboards (such as the famous one created by Johns Hopkins University) became the global standard for tracking infection rates, testing locations, and vaccine distribution in real-time on a geographic basis.
Business, Retail, and Marketing
In the private sector, GIS powers Location Intelligence. Retailers use GIS for site selection, analyzing demographic data, foot traffic, and competitor locations before opening a new store. Marketers use spatial data to understand consumer behavior regionally and launch highly targeted, geo-fenced advertising campaigns.
Emergency Management and Disaster Response
When natural disasters strike, be it a hurricane, wildfire, or earthquake, GIS provides critical situational awareness. Emergency managers use GIS to map evacuation routes, track the perimeter of wildfires, predict flood inundation zones, and coordinate the deployment of first responders to the areas of most critical need based on real-time spatial data.
7. The Future of GIS: Where Are We Heading?
The GIS industry is experiencing a period of rapid, unprecedented innovation. As technology evolves, GIS is becoming more integrated, intelligent, and accessible. Several key trends are shaping the future of geospatial technology:
A. Integration with Artificial Intelligence (GeoAI)
Geospatial Artificial Intelligence (GeoAI) is revolutionizing how we process spatial data. Machine learning algorithms can now rapidly analyze massive volumes of satellite imagery to automatically identify features, like extracting every building footprint in a city or assessing roof damage across thousands of homes immediately following a hurricane, a task that would take humans months to complete manually.
B. Web GIS and Cloud Computing
GIS is moving aggressively from desktop silos to the cloud. Web GIS allows organizations to host massive datasets on centralized cloud servers, enabling multiple users across the globe to access, edit, and analyze the same map simultaneously through standard web browsers. This democratization of data ensures that spatial insights are no longer locked away with GIS specialists but are accessible to everyday decision-makers.
C. 3D GIS and Digital Twins
Traditional 2D mapping is giving way to immersive 3D GIS. The concept of the "Digital Twin", a highly accurate, virtual 3D replica of a physical city or infrastructure network, is gaining immense traction. 3D GIS allows urban planners to visualize how a proposed skyscraper will alter the city skyline, cast shadows, and impact local wind patterns before a single shovel hits the ground.
D. Real-Time GIS and the Internet of Things (IoT)
With billions of IoT sensors constantly streaming data from smartphones, vehicles, smart meters, and weather stations, GIS is shifting from analyzing historical data to analyzing real-time data streams. Modern GIS dashboards can ingest and map live data, allowing organizations to monitor assets, track moving fleets, and respond to incidents the second they occur.
Conclusion: The Indispensable Role of Location Intelligence
To ask "What is GIS?" is to ask how we interpret the complex, interconnected world around us. A Geographic Information System is no longer a niche, specialized tool relegated to back-office cartographers. It is a dynamic, foundational technology that powers the modern digital economy, guides critical governmental decisions, and helps us confront some of the most pressing global challenges of our time, from urbanization to climate change.
By transforming raw, disparate data points into cohesive, visual narratives, GIS provides us with something invaluable: spatial context. It allows us to see relationships that were previously hidden, to make decisions based on empirical geographic evidence rather than intuition, and to manage our resources, our businesses, and our planet with unprecedented precision and foresight.
Whether you are a student exploring a new career path, a business owner looking to optimize your logistics, or a citizen interested in how your city operates, understanding the basics of GIS and location intelligence is an essential skill for navigating the future. Geography matters, and GIS is the definitive technology that proves it.
